|
Download Data (XLS File) |
|
||||||||
|
||||||||
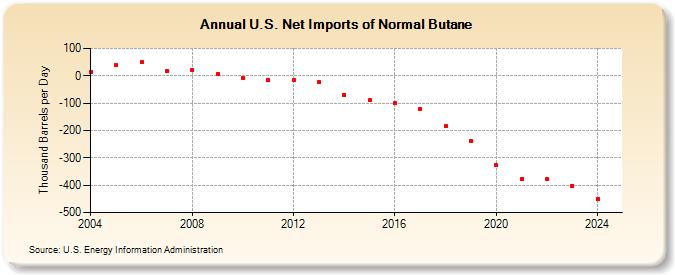
| U.S. Net Imports of Normal Butane (Thousand Barrels per Day) | ||||||||
| Decade | Year-0 | Year-1 | Year-2 | Year-3 | Year-4 | Year-5 | Year-6 | Year-7 | Year-8 | Year-9 |
|---|---|---|---|---|---|---|---|---|---|---|
| 2000's | 15 | 40 | 49 | 19 | 22 | 6 | ||||
| 2010's | -10 | -16 | -17 | -24 | -70 | -90 | -99 | -121 | -185 | -240 |
| 2020's | -327 | -377 | -378 | -425 |
| - = No Data Reported; -- = Not Applicable; NA = Not Available; W = Withheld to avoid disclosure of individual company data. |
| Release Date: 6/28/2024 |
| Next Release Date: 8/30/2024 |