|
Download Data (XLS File) |
|
||||||||
|
||||||||
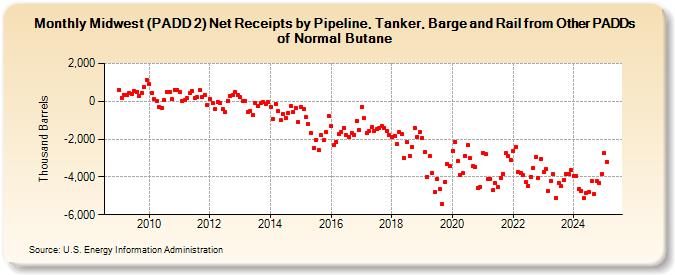
| Midwest (PADD 2) Net Receipts by Pipeline, Tanker, Barge and Rail from Other PADDs of Normal Butane (Thousand Barrels) | ||||||||
| Year | Jan | Feb | Mar | Apr | May | Jun | Jul | Aug | Sep | Oct | Nov | Dec |
|---|---|---|---|---|---|---|---|---|---|---|---|---|
| 2009 | 620 | 188 | 324 | 325 | 439 | 371 | 566 | 505 | 296 | 458 | 742 | 1,140 |
| 2010 | 891 | 433 | 99 | 10 | -294 | -359 | 44 | 480 | 516 | 98 | 608 | 608 |
| 2011 | 494 | 15 | 68 | 165 | 430 | 534 | 185 | 207 | 574 | 238 | 330 | -184 |
| 2012 | 108 | -70 | -418 | -12 | -66 | -428 | -545 | 36 | 277 | 342 | 489 | 323 |
| 2013 | 205 | 15 | 20 | -580 | -522 | -722 | -68 | -251 | -112 | -58 | -130 | -46 |
| 2014 | -292 | -952 | -137 | -522 | -994 | -689 | -879 | -601 | -245 | -561 | -348 | -1,120 |
| 2015 | -299 | -434 | -847 | -1,227 | -1,694 | -2,493 | -2,024 | -2,597 | -1,799 | -2,062 | -1,648 | -785 |
| 2016 | -1,327 | -2,338 | -2,141 | -1,739 | -1,605 | -1,425 | -1,784 | -1,870 | -1,692 | -1,772 | -1,017 | -1,493 |
| 2017 | -287 | -906 | -1,676 | -1,591 | -1,375 | -1,598 | -1,466 | -1,435 | -1,286 | -1,406 | -1,570 | -1,774 |
| 2018 | -1,872 | -1,815 | -2,246 | -1,625 | -1,751 | -2,997 | -2,171 | -2,879 | -2,399 | -1,388 | -1,872 | -1,615 |
| 2019 | -1,936 | -2,677 | -3,982 | -2,917 | -3,792 | -4,818 | -4,106 | -4,632 | -5,444 | -4,252 | -3,303 | -3,445 |
| 2020 | -2,611 | -2,159 | -3,179 | -3,909 | -3,810 | -2,881 | -2,302 | -3,023 | -3,437 | -3,450 | -4,568 | -4,526 |
| 2021 | -2,709 | -2,787 | -4,126 | -4,091 | -4,702 | -4,325 | -4,545 | -4,034 | -3,832 | -2,752 | -2,914 | -3,088 |
| 2022 | -2,642 | -2,422 | -3,759 | -3,806 | -3,923 | -4,271 | -4,464 | -3,980 | -3,511 | -2,929 | -4,036 | -3,031 |
| 2023 | -3,827 | -3,570 | -4,659 | -4,588 | -3,858 | -5,090 | -4,311 | -4,496 | -4,335 | -3,839 | -3,850 | -3,831 |
| 2024 | -3,279 | |||||||||||
| - = No Data Reported; -- = Not Applicable; NA = Not Available; W = Withheld to avoid disclosure of individual company data. |
| Release Date: 3/29/2024 |
| Next Release Date: 4/30/2024 |