|
Download Data (XLS File) |
|
||||||||
|
||||||||
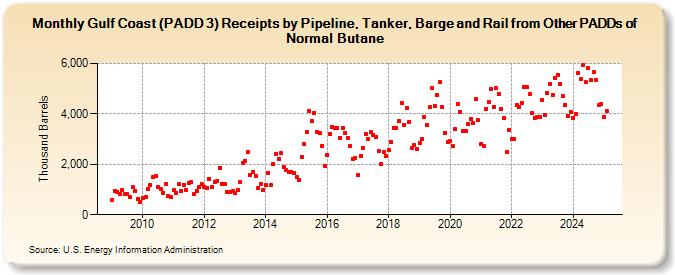
| Gulf Coast (PADD 3) Receipts by Pipeline, Tanker, Barge and Rail from Other PADDs of Normal Butane (Thousand Barrels) | ||||||||
| Year | Jan | Feb | Mar | Apr | May | Jun | Jul | Aug | Sep | Oct | Nov | Dec |
|---|---|---|---|---|---|---|---|---|---|---|---|---|
| 2009 | 586 | 934 | 918 | 825 | 989 | 809 | 810 | 721 | 1,087 | 943 | 622 | 514 |
| 2010 | 679 | 714 | 1,033 | 1,184 | 1,495 | 1,531 | 1,092 | 1,001 | 874 | 1,223 | 733 | 711 |
| 2011 | 962 | 863 | 1,200 | 936 | 1,193 | 996 | 1,269 | 1,297 | 830 | 931 | 1,100 | 1,206 |
| 2012 | 1,114 | 1,064 | 1,415 | 1,111 | 1,298 | 1,339 | 1,858 | 1,221 | 1,220 | 896 | 908 | 930 |
| 2013 | 865 | 974 | 1,305 | 2,041 | 2,144 | 2,492 | 1,589 | 1,694 | 1,529 | 1,066 | 1,226 | 969 |
| 2014 | 1,165 | 1,662 | 1,165 | 1,993 | 2,392 | 2,208 | 2,446 | 1,886 | 1,762 | 1,703 | 1,681 | 1,645 |
| 2015 | 1,484 | 1,397 | 2,304 | 2,787 | 3,285 | 4,104 | 3,712 | 4,046 | 3,288 | 3,228 | 2,742 | 1,931 |
| 2016 | 2,374 | 3,203 | 3,491 | 3,448 | 3,457 | 3,059 | 3,433 | 3,246 | 3,047 | 2,731 | 2,224 | 2,262 |
| 2017 | 1,565 | 2,343 | 2,627 | 3,215 | 3,013 | 3,278 | 3,177 | 3,073 | 2,511 | 1,997 | 2,497 | 2,343 |
| 2018 | 2,564 | 2,879 | 3,456 | 3,450 | 3,706 | 4,429 | 3,572 | 4,241 | 3,689 | 2,665 | 2,770 | 2,604 |
| 2019 | 2,856 | 2,999 | 3,877 | 3,571 | 4,281 | 5,015 | 4,323 | 4,731 | 5,257 | 4,255 | 3,250 | 2,872 |
| 2020 | 2,924 | 2,715 | 3,398 | 4,401 | 4,093 | 3,335 | 3,321 | 3,593 | 3,792 | 3,647 | 4,582 | 3,746 |
| 2021 | 2,825 | 2,738 | 4,189 | 4,480 | 4,974 | 4,282 | 5,046 | 4,800 | 4,208 | 3,846 | 2,496 | 3,343 |
| 2022 | 3,017 | 3,019 | 4,352 | 4,291 | 4,423 | 5,078 | 5,048 | 4,799 | 4,016 | 3,829 | 3,866 | 3,889 |
| 2023 | 4,542 | 3,973 | 4,832 | 5,161 | 4,738 | 5,440 | 5,547 | 5,168 | 4,708 | 4,370 | 3,923 | 4,088 |
| 2024 | 3,720 | |||||||||||
| - = No Data Reported; -- = Not Applicable; NA = Not Available; W = Withheld to avoid disclosure of individual company data. |
| Release Date: 3/29/2024 |
| Next Release Date: 4/30/2024 |