|
Download Data (XLS File) |
|
||||||||
|
||||||||
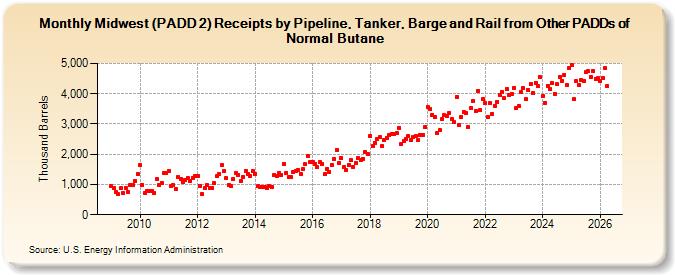
| Midwest (PADD 2) Receipts by Pipeline, Tanker, Barge and Rail from Other PADDs of Normal Butane (Thousand Barrels) | ||||||||
| Year | Jan | Feb | Mar | Apr | May | Jun | Jul | Aug | Sep | Oct | Nov | Dec |
|---|---|---|---|---|---|---|---|---|---|---|---|---|
| 2009 | 952 | 868 | 754 | 672 | 869 | 723 | 885 | 751 | 970 | 977 | 1,108 | 1,341 |
| 2010 | 1,630 | 987 | 726 | 789 | 773 | 771 | 703 | 1,180 | 985 | 1,047 | 1,389 | 1,382 |
| 2011 | 1,451 | 961 | 981 | 861 | 1,254 | 1,183 | 1,093 | 1,147 | 1,202 | 1,102 | 1,230 | 1,270 |
| 2012 | 1,279 | 963 | 687 | 873 | 978 | 876 | 881 | 1,035 | 1,267 | 1,349 | 1,628 | 1,431 |
| 2013 | 1,200 | 978 | 954 | 1,177 | 1,376 | 1,313 | 1,102 | 1,259 | 1,455 | 1,356 | 1,288 | 1,442 |
| 2014 | 1,356 | 941 | 930 | 928 | 918 | 890 | 947 | 909 | 1,325 | 1,291 | 1,387 | 1,321 |
| 2015 | 1,687 | 1,384 | 1,244 | 1,254 | 1,415 | 1,450 | 1,494 | 1,355 | 1,507 | 1,668 | 1,938 | 1,741 |
| 2016 | 1,759 | 1,686 | 1,566 | 1,740 | 1,685 | 1,338 | 1,511 | 1,413 | 1,644 | 1,842 | 2,145 | 1,704 |
| 2017 | 1,873 | 1,571 | 1,489 | 1,636 | 1,804 | 1,587 | 1,709 | 1,871 | 1,793 | 1,854 | 2,058 | 1,991 |
| 2018 | 2,610 | 2,278 | 2,378 | 2,488 | 2,557 | 2,272 | 2,456 | 2,552 | 2,625 | 2,684 | 2,684 | 2,694 |
| 2019 | 2,878 | 2,349 | 2,431 | 2,514 | 2,610 | 2,463 | 2,570 | 2,616 | 2,456 | 2,626 | 2,650 | 2,900 |
| 2020 | 3,572 | 3,488 | 3,309 | 3,221 | 2,688 | 2,795 | 3,165 | 3,287 | 3,271 | 3,355 | 3,172 | 3,057 |
| 2021 | 3,887 | 2,971 | 3,240 | 3,390 | 3,364 | 2,886 | 3,533 | 3,757 | 3,434 | 4,105 | 3,453 | 3,825 |
| 2022 | 3,690 | 3,234 | 3,688 | 3,337 | 3,606 | 3,729 | 3,974 | 4,068 | 3,844 | 4,159 | 3,946 | 3,996 |
| 2023 | 4,143 | 3,517 | 3,584 | 4,021 | 4,175 | 3,814 | 4,131 | 4,318 | 3,845 | 4,365 | 4,272 | 4,528 |
| 2024 | 3,967 | |||||||||||
| - = No Data Reported; -- = Not Applicable; NA = Not Available; W = Withheld to avoid disclosure of individual company data. |
| Release Date: 3/29/2024 |
| Next Release Date: 4/30/2024 |