|
Download Data (XLS File) |
|
||||||||
|
||||||||
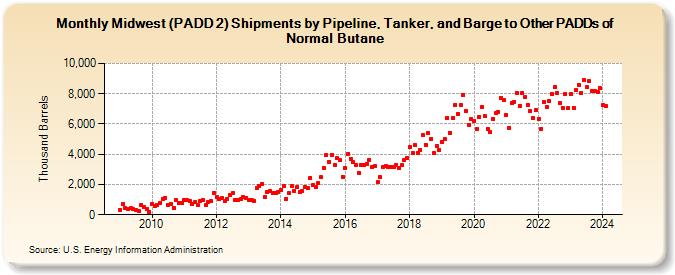
| Midwest (PADD 2) Shipments by Pipeline, Tanker, and Barge to Other PADDs of Normal Butane (Thousand Barrels) | ||||||||
| Year | Jan | Feb | Mar | Apr | May | Jun | Jul | Aug | Sep | Oct | Nov | Dec |
|---|---|---|---|---|---|---|---|---|---|---|---|---|
| 2009 | 332 | 680 | 430 | 347 | 430 | 352 | 319 | 246 | 674 | 519 | 366 | 201 |
| 2010 | 739 | 554 | 627 | 779 | 1,067 | 1,130 | 659 | 700 | 469 | 949 | 781 | 774 |
| 2011 | 957 | 946 | 913 | 696 | 824 | 649 | 908 | 940 | 628 | 864 | 900 | 1,454 |
| 2012 | 1,171 | 1,033 | 1,105 | 885 | 1,044 | 1,304 | 1,426 | 999 | 990 | 1,007 | 1,139 | 1,108 |
| 2013 | 995 | 963 | 934 | 1,757 | 1,898 | 2,035 | 1,170 | 1,510 | 1,567 | 1,414 | 1,418 | 1,488 |
| 2014 | 1,648 | 1,893 | 1,067 | 1,450 | 1,912 | 1,579 | 1,826 | 1,510 | 1,570 | 1,852 | 1,735 | 2,441 |
| 2015 | 1,986 | 1,818 | 2,091 | 2,481 | 3,109 | 3,943 | 3,518 | 3,952 | 3,306 | 3,730 | 3,586 | 2,526 |
| 2016 | 3,086 | 4,024 | 3,707 | 3,479 | 3,290 | 2,763 | 3,295 | 3,283 | 3,336 | 3,614 | 3,162 | 3,197 |
| 2017 | 2,160 | 2,477 | 3,165 | 3,227 | 3,179 | 3,185 | 3,175 | 3,306 | 3,079 | 3,260 | 3,628 | 3,765 |
| 2018 | 4,482 | 4,093 | 4,624 | 4,113 | 4,308 | 5,269 | 4,627 | 5,431 | 5,024 | 4,072 | 4,556 | 4,309 |
| 2019 | 4,814 | 5,026 | 6,413 | 5,431 | 6,402 | 7,281 | 6,676 | 7,248 | 7,900 | 6,878 | 5,953 | 6,345 |
| 2020 | 6,183 | 5,647 | 6,488 | 7,130 | 6,498 | 5,676 | 5,467 | 6,310 | 6,708 | 6,805 | 7,740 | 7,583 |
| 2021 | 6,596 | 5,758 | 7,366 | 7,481 | 8,066 | 7,211 | 8,078 | 7,791 | 7,266 | 6,857 | 6,367 | 6,913 |
| 2022 | 6,332 | 5,657 | 7,447 | 7,143 | 7,529 | 8,000 | 8,439 | 8,048 | 7,355 | 7,088 | 7,982 | 7,027 |
| 2023 | 7,970 | 7,087 | 8,243 | 8,609 | 8,033 | 8,904 | 8,442 | 8,814 | 8,180 | 8,204 | 8,122 | 8,359 |
| 2024 | 7,246 | |||||||||||
| - = No Data Reported; -- = Not Applicable; NA = Not Available; W = Withheld to avoid disclosure of individual company data. |
| Release Date: 3/29/2024 |
| Next Release Date: 4/30/2024 |