|
Download Data (XLS File) |
|
||||||||
|
||||||||
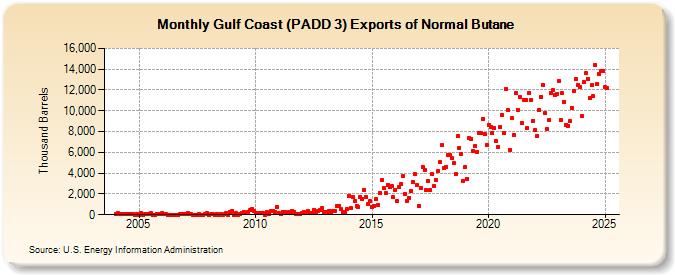
| Gulf Coast (PADD 3) Exports of Normal Butane (Thousand Barrels) | ||||||||
| Year | Jan | Feb | Mar | Apr | May | Jun | Jul | Aug | Sep | Oct | Nov | Dec |
|---|---|---|---|---|---|---|---|---|---|---|---|---|
| 2004 | 104 | 134 | 36 | 22 | 23 | 49 | 33 | 96 | 50 | 65 | 19 | 49 |
| 2005 | 18 | 160 | 20 | 55 | 44 | 74 | 130 | 20 | 13 | 71 | 40 | 29 |
| 2006 | 175 | 66 | 32 | 10 | 8 | 9 | 7 | 9 | 10 | 49 | 44 | 57 |
| 2007 | 50 | 171 | 82 | 49 | 8 | 12 | 7 | 25 | 16 | 12 | 26 | 146 |
| 2008 | 15 | 43 | 42 | 6 | 57 | 20 | 33 | 6 | 22 | 152 | 8 | 244 |
| 2009 | 364 | 16 | 128 | 5 | 22 | 211 | 219 | 135 | 249 | 424 | 557 | 347 |
| 2010 | 185 | 157 | 126 | 152 | 124 | 4 | 229 | 103 | 384 | 390 | 245 | 778 |
| 2011 | 129 | 28 | 285 | 236 | 170 | 265 | 212 | 368 | 220 | 110 | 61 | 54 |
| 2012 | 117 | 249 | 240 | 357 | 135 | 117 | 478 | 268 | 377 | 423 | 615 | 259 |
| 2013 | 297 | 299 | 399 | 133 | 382 | 364 | 866 | 807 | 504 | 254 | 229 | 544 |
| 2014 | 1,780 | 642 | 1,663 | 1,274 | 828 | 752 | 1,711 | 1,478 | 2,410 | 1,702 | 1,053 | 1,303 |
| 2015 | 765 | 884 | 1,496 | 970 | 2,104 | 3,310 | 2,600 | 2,085 | 2,889 | 2,685 | 2,790 | 1,681 |
| 2016 | 2,402 | 1,274 | 2,665 | 2,938 | 3,705 | 1,988 | 1,352 | 1,652 | 2,320 | 3,141 | 3,876 | 2,841 |
| 2017 | 875 | 2,560 | 4,625 | 4,302 | 2,344 | 3,273 | 2,401 | 3,913 | 2,779 | 3,295 | 4,186 | 5,062 |
| 2018 | 6,687 | 4,489 | 4,601 | 5,769 | 5,746 | 5,438 | 4,956 | 3,880 | 7,529 | 6,453 | 5,797 | 3,283 |
| 2019 | 4,550 | 3,439 | 7,374 | 7,321 | 6,156 | 6,569 | 6,064 | 7,880 | 7,825 | 9,227 | 7,786 | 6,753 |
| 2020 | 8,651 | 8,478 | 7,842 | 8,325 | 7,088 | 6,557 | 8,392 | 9,593 | 7,824 | 12,088 | 10,030 | 6,254 |
| 2021 | 9,271 | 7,712 | 11,706 | 10,102 | 11,316 | 8,862 | 11,071 | 11,066 | 8,357 | 11,719 | 11,076 | 9,048 |
| 2022 | 8,120 | 7,600 | 10,061 | 11,332 | 12,478 | 9,773 | 8,248 | 9,104 | 11,703 | 11,971 | 11,548 | 11,594 |
| 2023 | 13,378 | 11,327 | 11,532 | 11,928 | 9,282 | 9,850 | 9,932 | 10,850 | 13,272 | 13,041 | 12,502 | 12,365 |
| 2024 | 9,470 | 12,754 | 13,623 | 13,094 | ||||||||
| - = No Data Reported; -- = Not Applicable; NA = Not Available; W = Withheld to avoid disclosure of individual company data. |
| Release Date: 6/28/2024 |
| Next Release Date: 7/31/2024 |