|
Download Data (XLS File) |
|
||||||||
|
||||||||
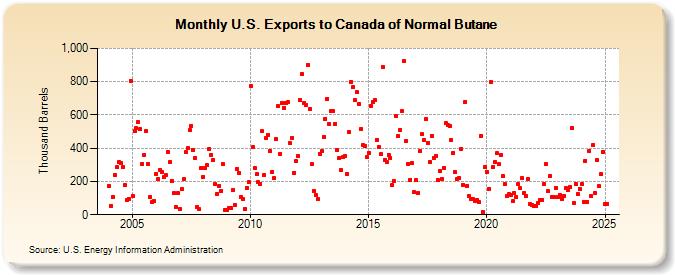
| U.S. Exports to Canada of Normal Butane (Thousand Barrels) | ||||||||
| Year | Jan | Feb | Mar | Apr | May | Jun | Jul | Aug | Sep | Oct | Nov | Dec |
|---|---|---|---|---|---|---|---|---|---|---|---|---|
| 2004 | 174 | 55 | 105 | 240 | 286 | 315 | 312 | 285 | 177 | 87 | 97 | 805 |
| 2005 | 113 | 506 | 520 | 556 | 514 | 307 | 360 | 504 | 303 | 106 | 75 | 85 |
| 2006 | 246 | 213 | 269 | 258 | 225 | 237 | 378 | 315 | 205 | 129 | 47 | 132 |
| 2007 | 35 | 153 | 212 | 376 | 400 | 507 | 535 | 391 | 340 | 47 | 32 | 281 |
| 2008 | 228 | 282 | 296 | 396 | 361 | 328 | 182 | 125 | 174 | 145 | 303 | 30 |
| 2009 | 29 | 43 | 38 | 150 | 58 | 277 | 252 | 107 | 95 | 33 | 163 | 195 |
| 2010 | 774 | 405 | 282 | 243 | 194 | 187 | 501 | 240 | 462 | 482 | 381 | 258 |
| 2011 | 220 | 454 | 652 | 368 | 674 | 644 | 674 | 676 | 429 | 463 | 253 | 320 |
| 2012 | 352 | 691 | 849 | 672 | 660 | 902 | 636 | 302 | 143 | 118 | 92 | 366 |
| 2013 | 383 | 470 | 578 | 698 | 543 | 623 | 622 | 548 | 392 | 342 | 267 | 345 |
| 2014 | 354 | 244 | 497 | 800 | 766 | 687 | 735 | 668 | 516 | 417 | 414 | 345 |
| 2015 | 373 | 656 | 678 | 687 | 451 | 408 | 363 | 889 | 329 | 318 | 360 | 341 |
| 2016 | 176 | 200 | 595 | 472 | 512 | 621 | 922 | 443 | 306 | 211 | 309 | 136 |
| 2017 | 208 | 131 | 384 | 483 | 448 | 575 | 430 | 319 | 475 | 343 | 355 | 210 |
| 2018 | 261 | 217 | 283 | 550 | 542 | 532 | 449 | 370 | 255 | 216 | 220 | 397 |
| 2019 | 181 | 680 | 175 | 112 | 93 | 93 | 82 | 87 | 74 | 476 | 19 | 287 |
| 2020 | 257 | 156 | 797 | 286 | 316 | 369 | 303 | 362 | 230 | 184 | 114 | 123 |
| 2021 | 121 | 80 | 132 | 106 | 184 | 158 | 218 | 130 | 113 | 214 | 64 | 59 |
| 2022 | 50 | 53 | 71 | 87 | 91 | 186 | 302 | 141 | 234 | 108 | 104 | 162 |
| 2023 | 107 | 121 | 95 | 110 | 158 | 146 | 164 | 522 | 72 | 187 | 126 | 157 |
| 2024 | 185 | |||||||||||
| - = No Data Reported; -- = Not Applicable; NA = Not Available; W = Withheld to avoid disclosure of individual company data. |
| Release Date: 3/29/2024 |
| Next Release Date: 4/30/2024 |