|
Download Data (XLS File) |
|
||||||||
|
||||||||
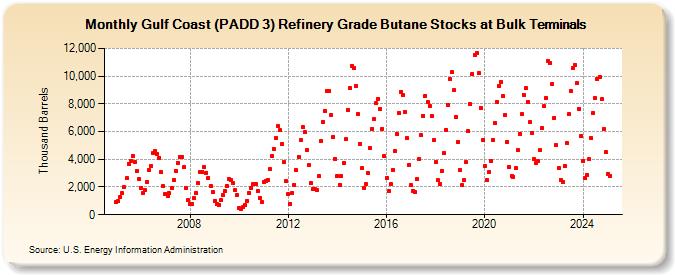
| Gulf Coast (PADD 3) Refinery Grade Butane Stocks at Bulk Terminals (Thousand Barrels) | ||||||||
| Year | Jan | Feb | Mar | Apr | May | Jun | Jul | Aug | Sep | Oct | Nov | Dec |
|---|---|---|---|---|---|---|---|---|---|---|---|---|
| 2005 | 935 | 954 | 1,278 | 1,548 | 1,994 | 2,625 | 3,686 | 3,879 | 4,236 | 3,815 | 3,168 | 2,589 |
| 2006 | 1,938 | 1,597 | 1,781 | 2,345 | 3,206 | 3,523 | 4,419 | 4,580 | 4,403 | 4,121 | 3,048 | 2,050 |
| 2007 | 1,506 | 1,373 | 1,537 | 1,926 | 2,534 | 3,184 | 3,731 | 4,191 | 4,193 | 3,415 | 1,946 | 1,028 |
| 2008 | 805 | 757 | 1,179 | 1,569 | 2,270 | 3,077 | 3,106 | 3,416 | 3,019 | 2,654 | 2,090 | 1,621 |
| 2009 | 1,021 | 749 | 725 | 1,029 | 1,398 | 1,722 | 2,101 | 2,579 | 2,491 | 2,261 | 1,767 | 1,423 |
| 2010 | 461 | 403 | 569 | 676 | 997 | 1,565 | 1,956 | 2,200 | 2,206 | 1,721 | 1,238 | 904 |
| 2011 | 2,335 | 2,457 | 2,510 | 3,276 | 4,234 | 4,757 | 5,505 | 6,367 | 6,082 | 5,132 | 3,771 | 2,398 |
| 2012 | 1,463 | 770 | 1,561 | 2,154 | 3,222 | 4,190 | 5,357 | 6,300 | 5,949 | 4,646 | 3,575 | 2,279 |
| 2013 | 1,863 | 1,847 | 1,778 | 2,779 | 5,299 | 6,675 | 7,517 | 8,960 | 8,915 | 7,213 | 5,616 | 4,022 |
| 2014 | 2,814 | 2,155 | 2,764 | 3,745 | 5,441 | 7,539 | 9,138 | 10,734 | 10,570 | 9,297 | 7,266 | 5,136 |
| 2015 | 3,355 | 1,943 | 2,204 | 3,002 | 4,822 | 6,168 | 6,881 | 8,039 | 8,362 | 7,612 | 6,188 | 4,229 |
| 2016 | 2,680 | 1,696 | 2,181 | 3,247 | 4,578 | 5,802 | 7,367 | 8,870 | 8,616 | 7,438 | 5,531 | 3,615 |
| 2017 | 2,125 | 1,745 | 1,635 | 2,581 | 3,999 | 5,733 | 7,151 | 8,570 | 8,108 | 7,878 | 7,116 | 5,377 |
| 2018 | 3,789 | 2,472 | 2,209 | 3,187 | 4,443 | 6,098 | 7,917 | 9,771 | 10,277 | 9,009 | 7,078 | 5,278 |
| 2019 | 3,251 | 2,137 | 2,474 | 3,782 | 6,021 | 7,968 | 10,158 | 11,548 | 11,678 | 10,214 | 7,703 | 5,396 |
| 2020 | 3,486 | 2,486 | 3,057 | 3,908 | 5,377 | 6,614 | 8,157 | 9,291 | 9,577 | 8,555 | 7,199 | 5,276 |
| 2021 | 3,435 | 2,804 | 2,740 | 3,351 | 4,645 | 5,842 | 7,240 | 8,661 | 9,137 | 8,157 | 6,659 | 5,864 |
| 2022 | 3,989 | 3,744 | 3,849 | 4,642 | 6,268 | 7,840 | 8,449 | 11,068 | 10,945 | 9,426 | 6,983 | 5,017 |
| 2023 | 3,358 | 2,509 | 2,382 | 3,505 | 5,164 | 7,242 | 8,956 | 10,593 | 10,807 | 9,470 | 7,650 | 5,687 |
| 2024 | 3,873 | 2,635 | 2,899 | 3,985 | 5,519 | 7,355 | 8,389 | 9,777 | 9,947 | 8,318 | 6,174 | 4,499 |
| 2025 | 2,947 | 2,790 | 3,272 | 4,221 | ||||||||
| - = No Data Reported; -- = Not Applicable; NA = Not Available; W = Withheld to avoid disclosure of individual company data. |
| Release Date: 6/30/2025 |
| Next Release Date: 7/31/2025 |