|
Download Data (XLS File) |
|
||||||||
|
||||||||
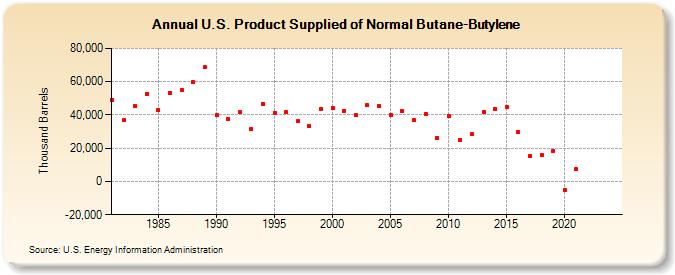
| U.S. Product Supplied of Normal Butane-Butylene (Thousand Barrels) | ||||||||
| Decade | Year-0 | Year-1 | Year-2 | Year-3 | Year-4 | Year-5 | Year-6 | Year-7 | Year-8 | Year-9 |
|---|---|---|---|---|---|---|---|---|---|---|
| 1980's | 48,968 | 36,885 | 45,351 | 52,487 | 42,885 | 53,447 | 55,151 | 59,612 | 68,741 | |
| 1990's | 40,151 | 37,385 | 41,504 | 31,342 | 46,817 | 41,249 | 41,541 | 36,190 | 33,041 | 43,398 |
| 2000's | 44,162 | 42,598 | 39,862 | 45,815 | 45,605 | 40,227 | 42,209 | 36,919 | 40,554 | 26,395 |
| 2010's | 39,359 | 24,815 | 28,233 | 41,816 | 43,322 | 44,869 | 29,695 | 15,215 | 15,806 | 18,440 |
| 2020's | -5,223 | 7,288 | -- | -- |
| - = No Data Reported; -- = Not Applicable; NA = Not Available; W = Withheld to avoid disclosure of individual company data. |
| Release Date: 3/29/2024 |
| Next Release Date: 8/30/2024 |