|
Download Data (XLS File) |
|
||||||||
|
||||||||
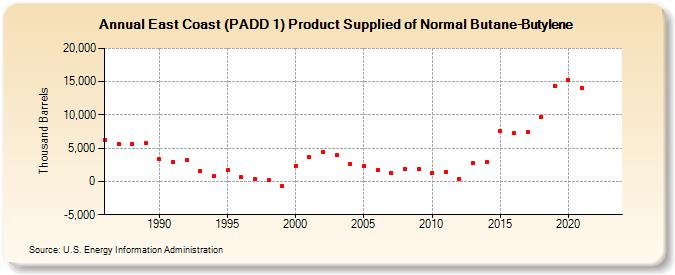
| East Coast (PADD 1) Product Supplied of Normal Butane-Butylene (Thousand Barrels) | ||||||||
| Decade | Year-0 | Year-1 | Year-2 | Year-3 | Year-4 | Year-5 | Year-6 | Year-7 | Year-8 | Year-9 |
|---|---|---|---|---|---|---|---|---|---|---|
| 1980's | 6,275 | 5,666 | 5,700 | 5,722 | ||||||
| 1990's | 3,324 | 2,933 | 3,187 | 1,568 | 806 | 1,735 | 611 | 410 | 215 | -705 |
| 2000's | 2,365 | 3,700 | 4,434 | 3,964 | 2,571 | 2,350 | 1,732 | 1,281 | 1,816 | 1,837 |
| 2010's | 1,317 | 1,468 | 387 | 2,705 | 2,861 | 7,518 | 7,224 | 7,495 | 9,708 | 14,420 |
| 2020's | 15,294 | 14,067 | -- | -- |
| - = No Data Reported; -- = Not Applicable; NA = Not Available; W = Withheld to avoid disclosure of individual company data. |
| Release Date: 6/28/2024 |
| Next Release Date: 8/30/2024 |