|
Download Data (XLS File) |
|
||||||||
|
||||||||
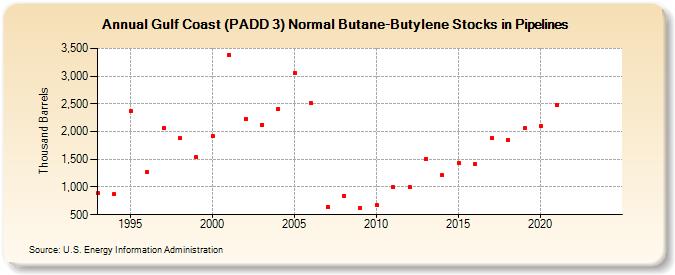
| Gulf Coast (PADD 3) Normal Butane-Butylene Stocks in Pipelines (Thousand Barrels) | ||||||||
| Decade | Year-0 | Year-1 | Year-2 | Year-3 | Year-4 | Year-5 | Year-6 | Year-7 | Year-8 | Year-9 |
|---|---|---|---|---|---|---|---|---|---|---|
| 1990's | 891 | 866 | 2,362 | 1,262 | 2,062 | 1,875 | 1,536 | |||
| 2000's | 1,911 | 3,385 | 2,231 | 2,127 | 2,403 | 3,062 | 2,506 | 640 | 838 | 621 |
| 2010's | 668 | 992 | 994 | 1,509 | 1,210 | 1,429 | 1,409 | 1,887 | 1,845 | 2,057 |
| 2020's | 2,092 | 2,471 | -- | -- | -- |
| - = No Data Reported; -- = Not Applicable; NA = Not Available; W = Withheld to avoid disclosure of individual company data. |
| Release Date: 6/30/2025 |
| Next Release Date: 8/29/2025 |