|
Download Data (XLS File) |
|
||||||||
|
||||||||
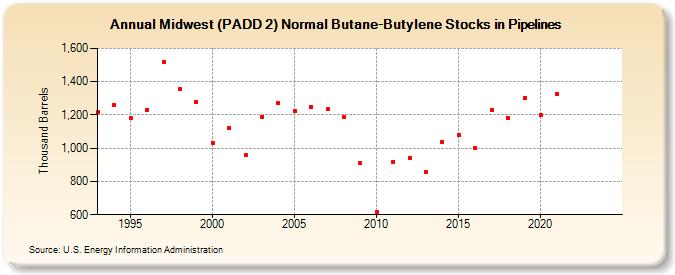
| Midwest (PADD 2) Normal Butane-Butylene Stocks in Pipelines (Thousand Barrels) | ||||||||
| Decade | Year-0 | Year-1 | Year-2 | Year-3 | Year-4 | Year-5 | Year-6 | Year-7 | Year-8 | Year-9 |
|---|---|---|---|---|---|---|---|---|---|---|
| 1990's | 1,215 | 1,259 | 1,179 | 1,231 | 1,517 | 1,355 | 1,280 | |||
| 2000's | 1,034 | 1,119 | 957 | 1,189 | 1,269 | 1,226 | 1,249 | 1,237 | 1,189 | 909 |
| 2010's | 616 | 918 | 940 | 859 | 1,039 | 1,082 | 1,004 | 1,232 | 1,179 | 1,303 |
| 2020's | 1,200 | 1,324 | -- | -- |
| - = No Data Reported; -- = Not Applicable; NA = Not Available; W = Withheld to avoid disclosure of individual company data. |
| Release Date: 3/29/2024 |
| Next Release Date: 8/30/2024 |