|
Download Data (XLS File) |
|
||||||||
|
||||||||
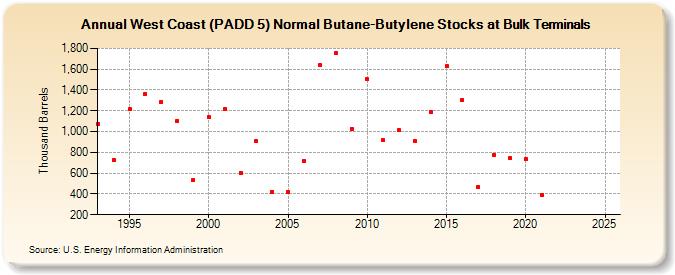
| West Coast (PADD 5) Normal Butane-Butylene Stocks at Bulk Terminals (Thousand Barrels) | ||||||||
| Decade | Year-0 | Year-1 | Year-2 | Year-3 | Year-4 | Year-5 | Year-6 | Year-7 | Year-8 | Year-9 |
|---|---|---|---|---|---|---|---|---|---|---|
| 1990's | 1,077 | 729 | 1,214 | 1,363 | 1,282 | 1,105 | 530 | |||
| 2000's | 1,139 | 1,213 | 605 | 907 | 420 | 419 | 721 | 1,642 | 1,754 | 1,027 |
| 2010's | 1,501 | 914 | 1,013 | 906 | 1,186 | 1,627 | 1,304 | 467 | 779 | 745 |
| 2020's | 734 | 390 | -- | -- |
| - = No Data Reported; -- = Not Applicable; NA = Not Available; W = Withheld to avoid disclosure of individual company data. |
| Release Date: 3/29/2024 |
| Next Release Date: 8/30/2024 |