|
Download Data (XLS File) |
|
||||||||
|
||||||||
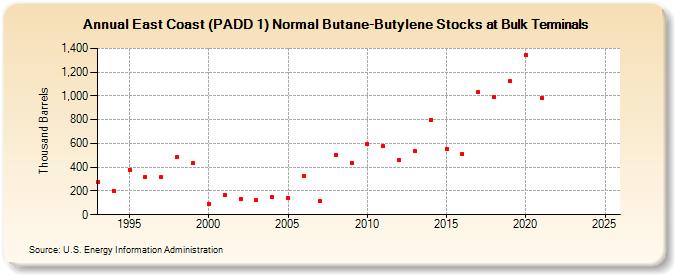
| East Coast (PADD 1) Normal Butane-Butylene Stocks at Bulk Terminals (Thousand Barrels) | ||||||||
| Decade | Year-0 | Year-1 | Year-2 | Year-3 | Year-4 | Year-5 | Year-6 | Year-7 | Year-8 | Year-9 |
|---|---|---|---|---|---|---|---|---|---|---|
| 1990's | 272 | 203 | 379 | 321 | 315 | 484 | 432 | |||
| 2000's | 93 | 166 | 134 | 121 | 153 | 143 | 328 | 118 | 500 | 439 |
| 2010's | 592 | 575 | 462 | 538 | 801 | 553 | 512 | 1,032 | 987 | 1,123 |
| 2020's | 1,346 | 985 | -- | -- |
| - = No Data Reported; -- = Not Applicable; NA = Not Available; W = Withheld to avoid disclosure of individual company data. |
| Release Date: 3/29/2024 |
| Next Release Date: 8/30/2024 |