|
Download Data (XLS File) |
|
||||||||
|
||||||||
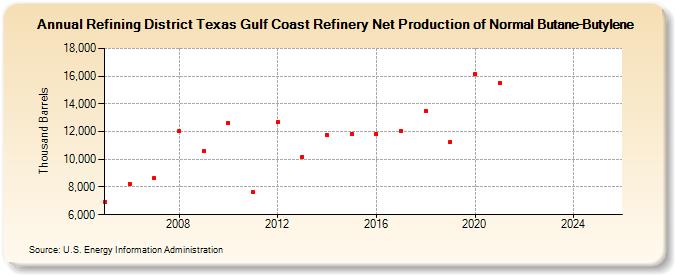
| Refining District Texas Gulf Coast Refinery Net Production of Normal Butane-Butylene (Thousand Barrels) | ||||||||
| Decade | Year-0 | Year-1 | Year-2 | Year-3 | Year-4 | Year-5 | Year-6 | Year-7 | Year-8 | Year-9 |
|---|---|---|---|---|---|---|---|---|---|---|
| 2000's | 6,937 | 8,252 | 8,620 | 12,037 | 10,594 | |||||
| 2010's | 12,651 | 7,624 | 12,685 | 10,168 | 11,746 | 11,853 | 11,813 | 12,069 | 13,494 | 11,264 |
| 2020's | 16,150 | 15,534 | -- | -- |
| - = No Data Reported; -- = Not Applicable; NA = Not Available; W = Withheld to avoid disclosure of individual company data. |
| Release Date: 6/28/2024 |
| Next Release Date: 8/30/2024 |