|
Download Data (XLS File) |
|
||||||||
|
||||||||
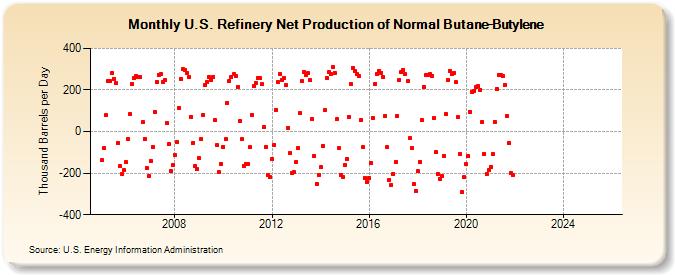
| U.S. Refinery Net Production of Normal Butane-Butylene (Thousand Barrels per Day) | ||||||||
| Year | Jan | Feb | Mar | Apr | May | Jun | Jul | Aug | Sep | Oct | Nov | Dec |
|---|---|---|---|---|---|---|---|---|---|---|---|---|
| 2005 | -137 | -80 | 78 | 244 | 243 | 281 | 255 | 232 | -55 | -167 | -204 | -186 |
| 2006 | -148 | -38 | 83 | 228 | 257 | 266 | 264 | 260 | 44 | -37 | -173 | -214 |
| 2007 | -142 | -75 | 96 | 240 | 274 | 278 | 239 | 246 | 42 | -60 | -188 | -163 |
| 2008 | -115 | -51 | 113 | 254 | 299 | 295 | 282 | 263 | 71 | -55 | -166 | -182 |
| 2009 | -128 | -36 | 82 | 222 | 237 | 260 | 248 | 264 | 54 | -67 | -196 | -154 |
| 2010 | -75 | -36 | 139 | 245 | 263 | 275 | 265 | 216 | 50 | -36 | -165 | -154 |
| 2011 | -155 | -76 | 81 | 218 | 234 | 258 | 257 | 227 | 21 | -74 | -210 | -217 |
| 2012 | -133 | -64 | 106 | 238 | 277 | 246 | 258 | 222 | 18 | -103 | -200 | -196 |
| 2013 | -146 | -79 | 90 | 242 | 286 | 271 | 280 | 246 | 58 | -116 | -251 | -210 |
| 2014 | -172 | -70 | 102 | 258 | 285 | 279 | 311 | 284 | 58 | -81 | -211 | -219 |
| 2015 | -161 | -132 | 72 | 227 | 307 | 292 | 276 | 265 | 56 | -75 | -224 | -241 |
| 2016 | -224 | -151 | 67 | 229 | 279 | 292 | 284 | 261 | 74 | -76 | -231 | -256 |
| 2017 | -203 | -146 | 74 | 250 | 285 | 298 | 276 | 241 | -33 | -81 | -252 | -285 |
| 2018 | -191 | -145 | 56 | 215 | 271 | 274 | 275 | 269 | 66 | -100 | -203 | -228 |
| 2019 | -213 | -119 | 84 | 246 | 293 | 275 | 283 | 237 | 68 | -109 | -291 | -221 |
| 2020 | -158 | -118 | 95 | 192 | 197 | 212 | 217 | 202 | 46 | -109 | -205 | -185 |
| 2021 | -169 | -110 | 48 | 206 | 272 | 271 | 265 | 224 | 75 | -54 | -201 | -207 |
| 2022 | -- | -- | -- | -- | -- | -- | -- | -- | -- | -- | -- | -- |
| 2023 | -- | -- | -- | -- | -- | -- | -- | -- | -- | -- | -- | -- |
| 2024 | -- | |||||||||||
| - = No Data Reported; -- = Not Applicable; NA = Not Available; W = Withheld to avoid disclosure of individual company data. |
| Release Date: 3/29/2024 |
| Next Release Date: 4/30/2024 |