|
Download Data (XLS File) |
|
||||||||
|
||||||||
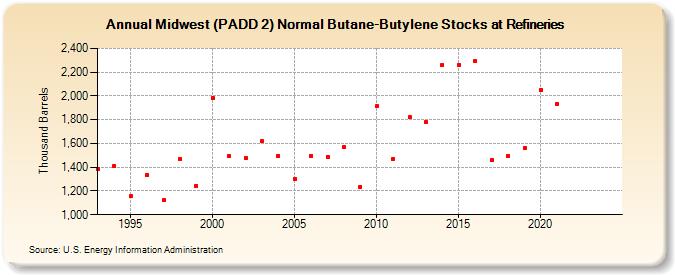
| Midwest (PADD 2) Normal Butane-Butylene Stocks at Refineries (Thousand Barrels) | ||||||||
| Decade | Year-0 | Year-1 | Year-2 | Year-3 | Year-4 | Year-5 | Year-6 | Year-7 | Year-8 | Year-9 |
|---|---|---|---|---|---|---|---|---|---|---|
| 1990's | 1,387 | 1,410 | 1,154 | 1,334 | 1,122 | 1,467 | 1,244 | |||
| 2000's | 1,986 | 1,494 | 1,479 | 1,617 | 1,497 | 1,303 | 1,495 | 1,490 | 1,566 | 1,236 |
| 2010's | 1,911 | 1,472 | 1,819 | 1,783 | 2,261 | 2,263 | 2,293 | 1,459 | 1,492 | 1,564 |
| 2020's | 2,052 | 1,936 | -- | -- |
| - = No Data Reported; -- = Not Applicable; NA = Not Available; W = Withheld to avoid disclosure of individual company data. |
| Release Date: 3/29/2024 |
| Next Release Date: 8/30/2024 |