|
Download Data (XLS File) |
|
||||||||
|
||||||||
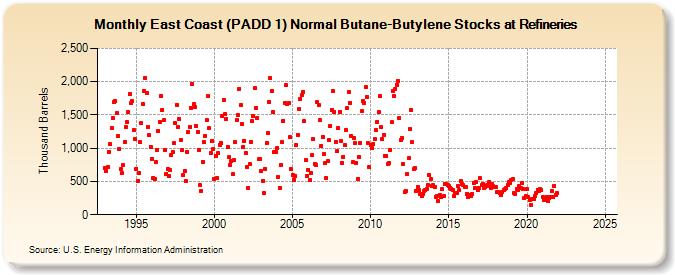
| East Coast (PADD 1) Normal Butane-Butylene Stocks at Refineries (Thousand Barrels) | ||||||||
| Year | Jan | Feb | Mar | Apr | May | Jun | Jul | Aug | Sep | Oct | Nov | Dec |
|---|---|---|---|---|---|---|---|---|---|---|---|---|
| 1993 | 709 | 659 | 715 | 949 | 1,060 | 1,306 | 1,457 | 1,693 | 1,706 | 1,526 | 1,185 | 988 |
| 1994 | 682 | 620 | 741 | 1,096 | 1,317 | 1,390 | 1,538 | 1,812 | 1,673 | 1,709 | 1,276 | 1,132 |
| 1995 | 692 | 503 | 632 | 1,090 | 1,377 | 1,660 | 1,862 | 2,056 | 1,825 | 1,323 | 1,197 | 1,022 |
| 1996 | 841 | 552 | 533 | 793 | 975 | 1,264 | 1,398 | 1,781 | 1,577 | 1,418 | 969 | 616 |
| 1997 | 688 | 577 | 665 | 891 | 942 | 1,072 | 1,377 | 1,650 | 1,320 | 1,439 | 1,120 | 971 |
| 1998 | 590 | 655 | 501 | 950 | 1,237 | 1,323 | 1,606 | 1,965 | 1,657 | 1,618 | 1,339 | 1,247 |
| 1999 | 979 | 441 | 358 | 798 | 1,088 | 1,190 | 1,419 | 1,780 | 1,301 | 925 | 1,114 | 985 |
| 2000 | 536 | 889 | 555 | 926 | 1,052 | 1,078 | 1,477 | 1,730 | 1,510 | 1,443 | 1,020 | 863 |
| 2001 | 753 | 804 | 607 | 820 | 1,089 | 1,420 | 1,497 | 1,896 | 1,647 | 1,364 | 1,016 | 1,113 |
| 2002 | 933 | 723 | 408 | 763 | 1,092 | 1,411 | 1,489 | 1,902 | 1,609 | 1,455 | 832 | 840 |
| 2003 | 651 | 514 | 319 | 693 | 1,084 | 1,222 | 1,691 | 2,053 | 1,856 | 1,543 | 946 | 945 |
| 2004 | 997 | 566 | 406 | 744 | 1,086 | 1,411 | 1,686 | 1,943 | 1,669 | 1,682 | 1,162 | 681 |
| 2005 | 591 | 525 | 580 | 1,046 | 1,200 | 1,584 | 1,745 | 1,796 | 1,851 | 1,402 | 822 | 587 |
| 2006 | 676 | 517 | 623 | 892 | 1,135 | 764 | 744 | 1,690 | 1,650 | 1,419 | 1,035 | 1,169 |
| 2007 | 920 | 770 | 553 | 811 | 1,116 | 1,336 | 1,578 | 1,864 | 1,541 | 1,098 | 953 | 1,303 |
| 2008 | 1,548 | 1,101 | 783 | 874 | 1,051 | 1,277 | 1,597 | 1,849 | 1,683 | 1,184 | 786 | 1,159 |
| 2009 | 1,075 | 782 | 540 | 871 | 1,085 | 1,553 | 1,714 | 1,682 | 1,913 | 1,772 | 1,073 | 710 |
| 2010 | 1,042 | 999 | 1,062 | 1,134 | 1,270 | 1,398 | 1,537 | 1,778 | 1,312 | 1,134 | 1,203 | 887 |
| 2011 | 890 | 760 | 775 | 975 | 1,388 | 1,855 | 1,784 | 1,897 | 1,956 | 2,014 | 1,455 | 1,118 |
| 2012 | 1,157 | 759 | 343 | 352 | 618 | 845 | 1,285 | 1,579 | 1,087 | 687 | 701 | 356 |
| 2013 | 420 | 365 | 307 | 275 | 314 | 350 | 366 | 387 | 446 | 600 | 531 | 434 |
| 2014 | 440 | 415 | 273 | 281 | 200 | 298 | 265 | 383 | 282 | 462 | 464 | 450 |
| 2015 | 439 | 405 | 388 | 364 | 281 | 326 | 319 | 433 | 365 | 504 | 458 | 440 |
| 2016 | 422 | 420 | 318 | 269 | 301 | 285 | 313 | 482 | 397 | 486 | 365 | 409 |
| 2017 | 546 | 441 | 460 | 398 | 412 | 442 | 436 | 492 | 403 | 456 | 426 | 423 |
| 2018 | 417 | 337 | 343 | 325 | 291 | 347 | 372 | 384 | 402 | 454 | 494 | 470 |
| 2019 | 526 | 532 | 332 | 315 | 392 | 372 | 425 | 397 | 484 | 388 | 257 | 284 |
| 2020 | 379 | 270 | 226 | 152 | 236 | 238 | 287 | 320 | 376 | 360 | 379 | 369 |
| 2021 | 261 | 226 | 220 | 270 | 199 | 246 | 261 | 349 | 267 | 433 | 298 | 329 |
| 2022 | -- | -- | -- | -- | -- | -- | -- | -- | -- | -- | -- | -- |
| 2023 | -- | -- | -- | -- | -- | -- | -- | -- | -- | -- | -- | -- |
| 2024 | -- | -- | -- | -- | ||||||||
| - = No Data Reported; -- = Not Applicable; NA = Not Available; W = Withheld to avoid disclosure of individual company data. |
| Release Date: 6/28/2024 |
| Next Release Date: 7/31/2024 |