|
Download Data (XLS File) |
|
||||||||
|
||||||||
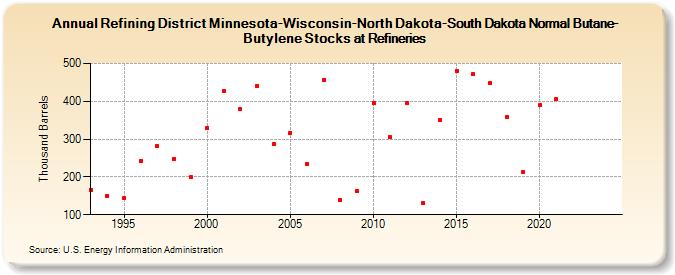
| Refining District Minnesota-Wisconsin-North Dakota-South Dakota Normal Butane-Butylene Stocks at Refineries (Thousand Barrels) | ||||||||
| Decade | Year-0 | Year-1 | Year-2 | Year-3 | Year-4 | Year-5 | Year-6 | Year-7 | Year-8 | Year-9 |
|---|---|---|---|---|---|---|---|---|---|---|
| 1990's | 166 | 150 | 144 | 243 | 281 | 248 | 199 | |||
| 2000's | 330 | 426 | 379 | 441 | 286 | 317 | 235 | 457 | 139 | 163 |
| 2010's | 396 | 305 | 396 | 130 | 350 | 481 | 471 | 448 | 358 | 212 |
| 2020's | 390 | 406 | -- | -- |
| - = No Data Reported; -- = Not Applicable; NA = Not Available; W = Withheld to avoid disclosure of individual company data. |
| Release Date: 3/29/2024 |
| Next Release Date: 8/30/2024 |