|
Download Data (XLS File) |
|
||||||||
|
||||||||
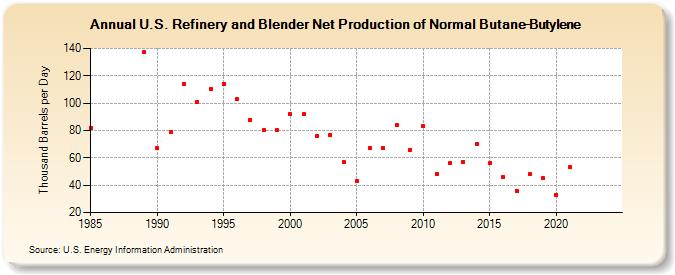
| U.S. Refinery and Blender Net Production of Normal Butane-Butylene (Thousand Barrels per Day) | ||||||||
| Decade | Year-0 | Year-1 | Year-2 | Year-3 | Year-4 | Year-5 | Year-6 | Year-7 | Year-8 | Year-9 |
|---|---|---|---|---|---|---|---|---|---|---|
| 1980's | 82 | 137 | ||||||||
| 1990's | 67 | 79 | 114 | 101 | 110 | 114 | 103 | 88 | 80 | 80 |
| 2000's | 92 | 92 | 76 | 77 | 57 | 43 | 67 | 67 | 84 | 66 |
| 2010's | 83 | 48 | 56 | 57 | 70 | 56 | 46 | 36 | 48 | 45 |
| 2020's | 33 | 53 | -- | -- |
| - = No Data Reported; -- = Not Applicable; NA = Not Available; W = Withheld to avoid disclosure of individual company data. |
| Release Date: 3/29/2024 |
| Next Release Date: 8/30/2024 |