|
Download Data (XLS File) |
|
||||||||
|
||||||||
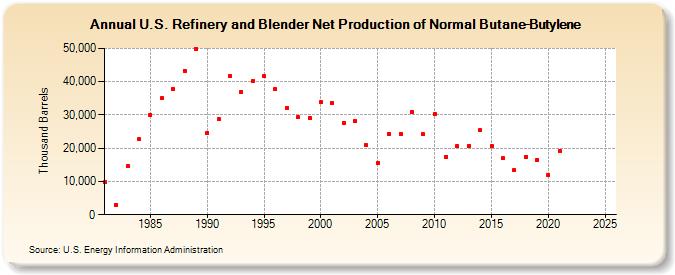
| U.S. Refinery and Blender Net Production of Normal Butane-Butylene (Thousand Barrels) | ||||||||
| Decade | Year-0 | Year-1 | Year-2 | Year-3 | Year-4 | Year-5 | Year-6 | Year-7 | Year-8 | Year-9 |
|---|---|---|---|---|---|---|---|---|---|---|
| 1980's | 9,754 | 3,023 | 14,519 | 22,671 | 30,078 | 35,010 | 37,728 | 43,353 | 49,909 | |
| 1990's | 24,612 | 28,671 | 41,774 | 36,926 | 40,271 | 41,550 | 37,669 | 32,202 | 29,333 | 29,216 |
| 2000's | 33,818 | 33,537 | 27,714 | 28,159 | 20,953 | 15,589 | 24,307 | 24,285 | 30,887 | 24,148 |
| 2010's | 30,281 | 17,449 | 20,580 | 20,737 | 25,412 | 20,590 | 16,959 | 13,313 | 17,433 | 16,551 |
| 2020's | 11,969 | 19,220 | -- | -- |
| - = No Data Reported; -- = Not Applicable; NA = Not Available; W = Withheld to avoid disclosure of individual company data. |
| Release Date: 8/30/2024 |
| Next Release Date: 8/29/2025 |