|
Download Data (XLS File) |
|
||||||||
|
||||||||
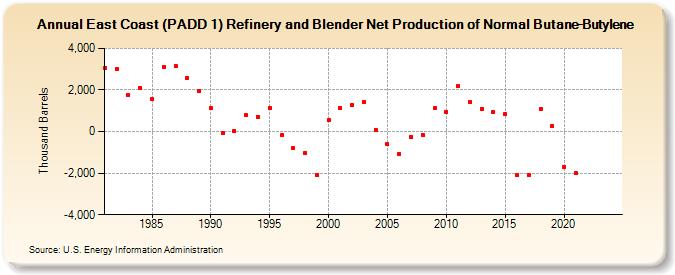
| East Coast (PADD 1) Refinery and Blender Net Production of Normal Butane-Butylene (Thousand Barrels) | ||||||||
| Decade | Year-0 | Year-1 | Year-2 | Year-3 | Year-4 | Year-5 | Year-6 | Year-7 | Year-8 | Year-9 |
|---|---|---|---|---|---|---|---|---|---|---|
| 1980's | 3,061 | 3,006 | 1,766 | 2,115 | 1,548 | 3,119 | 3,166 | 2,571 | 1,972 | |
| 1990's | 1,127 | -82 | 28 | 793 | 722 | 1,154 | -170 | -788 | -1,018 | -2,084 |
| 2000's | 553 | 1,137 | 1,258 | 1,437 | 97 | -612 | -1,079 | -253 | -167 | 1,123 |
| 2010's | 960 | 2,202 | 1,435 | 1,101 | 930 | 848 | -2,108 | -2,081 | 1,107 | 254 |
| 2020's | -1,693 | -2,000 | -- | -- |
| - = No Data Reported; -- = Not Applicable; NA = Not Available; W = Withheld to avoid disclosure of individual company data. |
| Release Date: 3/29/2024 |
| Next Release Date: 8/30/2024 |