|
Download Data (XLS File) |
|
||||||||
|
||||||||
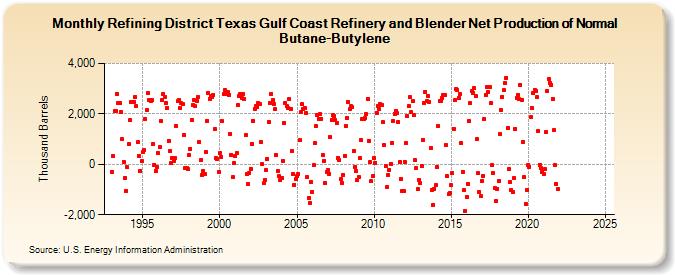
| Refining District Texas Gulf Coast Refinery and Blender Net Production of Normal Butane-Butylene (Thousand Barrels) | ||||||||
| Year | Jan | Feb | Mar | Apr | May | Jun | Jul | Aug | Sep | Oct | Nov | Dec |
|---|---|---|---|---|---|---|---|---|---|---|---|---|
| 1993 | -297 | 314 | 2,102 | 2,126 | 2,795 | 2,416 | 2,427 | 2,070 | 989 | 107 | -526 | -1,052 |
| 1994 | -124 | 804 | 1,740 | 2,470 | 2,453 | 2,486 | 2,678 | 2,304 | 871 | 342 | -255 | 116 |
| 1995 | 479 | 563 | 1,791 | 2,140 | 2,814 | 2,568 | 2,525 | 2,535 | 812 | -15 | -268 | -123 |
| 1996 | 448 | 669 | 1,724 | 2,551 | 2,795 | 2,687 | 2,436 | 2,253 | 944 | 521 | 38 | 256 |
| 1997 | 149 | 248 | 1,539 | 2,498 | 2,536 | 2,245 | 2,415 | 2,379 | 1,158 | -148 | -162 | -167 |
| 1998 | 374 | 611 | 1,773 | 2,361 | 2,554 | 2,302 | 2,520 | 2,661 | 897 | 162 | -416 | -248 |
| 1999 | -384 | 507 | 1,728 | 2,831 | 2,595 | 2,712 | 2,660 | 2,746 | 1,394 | 233 | 201 | -302 |
| 2000 | 441 | 290 | 1,708 | 2,790 | 2,947 | 2,795 | 2,858 | 2,758 | 1,222 | 388 | -516 | 34 |
| 2001 | 315 | 440 | 2,337 | 2,710 | 2,776 | 2,641 | 2,784 | 2,594 | 1,143 | -398 | -792 | -346 |
| 2002 | -170 | 816 | 1,731 | 2,207 | 2,313 | 2,270 | 2,428 | 2,382 | 870 | 3 | -759 | -626 |
| 2003 | -229 | 212 | 1,692 | 2,447 | 2,801 | 2,563 | 2,388 | 2,183 | 374 | -259 | -480 | -616 |
| 2004 | -526 | 143 | 1,652 | 2,442 | 2,307 | 2,225 | 2,575 | 2,200 | 523 | -383 | -802 | -583 |
| 2005 | -476 | -383 | 965 | 2,065 | 2,376 | 2,185 | 2,241 | 2,051 | -520 | -1,336 | -1,535 | -696 |
| 2006 | -1,086 | -28 | 831 | 1,516 | 1,953 | 1,808 | 1,980 | 1,807 | 360 | 144 | -737 | -296 |
| 2007 | -227 | -366 | 1,083 | 1,751 | 1,937 | 1,925 | 1,753 | 1,645 | 264 | 167 | -586 | -726 |
| 2008 | -410 | 345 | 1,527 | 1,838 | 2,462 | 2,192 | 2,299 | 2,258 | 524 | -96 | -265 | -637 |
| 2009 | -504 | 242 | 960 | 1,790 | 1,808 | 1,842 | 1,991 | 2,592 | 935 | 89 | -678 | -473 |
| 2010 | 248 | 66 | 2,053 | 2,330 | 2,188 | 2,374 | 2,347 | 1,666 | 756 | -83 | -882 | -412 |
| 2011 | -214 | 24 | 850 | 1,709 | 2,014 | 2,134 | 2,018 | 1,686 | 99 | -576 | -1,064 | -1,056 |
| 2012 | 100 | 836 | 1,905 | 2,307 | 2,659 | 2,057 | 2,493 | 1,965 | 155 | -165 | -996 | -631 |
| 2013 | -754 | -70 | 983 | 2,428 | 2,872 | 2,501 | 2,693 | 2,476 | 630 | -1,014 | -1,611 | -966 |
| 2014 | -836 | -123 | 1,531 | 2,507 | 2,531 | 2,645 | 2,757 | 2,769 | 768 | -483 | -1,193 | -1,127 |
| 2015 | -812 | -343 | 1,411 | 2,562 | 3,003 | 2,951 | 2,647 | 2,773 | 829 | -288 | -1,034 | -1,846 |
| 2016 | -1,281 | -771 | 1,706 | 2,415 | 2,897 | 2,834 | 3,024 | 2,712 | 1,001 | -363 | -1,091 | -1,270 |
| 2017 | -664 | -445 | 1,807 | 2,746 | 3,079 | 2,861 | 3,060 | 2,422 | -34 | -359 | -950 | -1,454 |
| 2018 | -960 | -647 | 1,184 | 2,137 | 2,673 | 2,947 | 3,213 | 3,438 | 1,443 | -203 | -707 | -1,024 |
| 2019 | -1,111 | -546 | 1,412 | 2,642 | 2,762 | 2,583 | 3,161 | 2,571 | 901 | -515 | -1,568 | -1,028 |
| 2020 | -33 | -95 | 1,864 | 2,230 | 2,837 | 2,957 | 2,912 | 2,658 | 1,317 | -14 | -158 | -325 |
| 2021 | -380 | -193 | 1,283 | 2,913 | 3,371 | 3,236 | 3,152 | 2,604 | 1,343 | -32 | -776 | -987 |
| 2022 | -- | -- | -- | -- | -- | -- | -- | -- | -- | -- | -- | -- |
| 2023 | -- | -- | -- | -- | -- | -- | -- | -- | -- | -- | -- | -- |
| 2024 | -- | -- | -- | -- | ||||||||
| - = No Data Reported; -- = Not Applicable; NA = Not Available; W = Withheld to avoid disclosure of individual company data. |
| Release Date: 6/28/2024 |
| Next Release Date: 7/31/2024 |