|
Download Data (XLS File) |
|
||||||||
|
||||||||
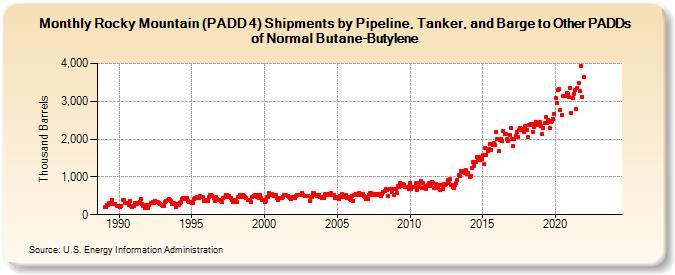
| Rocky Mountain (PADD 4) Shipments by Pipeline, Tanker, and Barge to Other PADDs of Normal Butane-Butylene (Thousand Barrels) | ||||||||
| Year | Jan | Feb | Mar | Apr | May | Jun | Jul | Aug | Sep | Oct | Nov | Dec |
|---|---|---|---|---|---|---|---|---|---|---|---|---|
| 1989 | 197 | 205 | 257 | 258 | 297 | 288 | 385 | 279 | 289 | 285 | 241 | 226 |
| 1990 | 230 | 203 | 242 | 377 | 377 | 305 | 302 | 301 | 268 | 361 | 227 | 217 |
| 1991 | 239 | 305 | 308 | 295 | 311 | 343 | 420 | 278 | 236 | 177 | 262 | 207 |
| 1992 | 179 | 258 | 305 | 322 | 340 | 322 | 358 | 349 | 339 | 322 | 283 | 248 |
| 1993 | 236 | 240 | 346 | 360 | 393 | 416 | 388 | 354 | 277 | 311 | 290 | 210 |
| 1994 | 283 | 248 | 318 | 329 | 426 | 437 | 427 | 453 | 439 | 359 | 342 | 330 |
| 1995 | 323 | 310 | 420 | 436 | 456 | 433 | 444 | 482 | 478 | 464 | 368 | 392 |
| 1996 | 372 | 353 | 463 | 521 | 534 | 501 | 447 | 369 | 459 | 416 | 380 | 378 |
| 1997 | 355 | 337 | 437 | 457 | 511 | 524 | 459 | 483 | 436 | 394 | 342 | 382 |
| 1998 | 356 | 339 | 466 | 470 | 515 | 479 | 524 | 487 | 465 | 431 | 391 | 396 |
| 1999 | 379 | 334 | 477 | 489 | 517 | 524 | 459 | 454 | 530 | 439 | 387 | 395 |
| 2000 | 347 | 355 | 462 | 462 | 567 | 523 | 537 | 526 | 490 | 519 | 434 | 389 |
| 2001 | 455 | 455 | 452 | 476 | 513 | 531 | 520 | 484 | 459 | 454 | 408 | 463 |
| 2002 | 469 | 443 | 504 | 527 | 525 | 525 | 511 | 576 | 511 | 505 | 501 | 498 |
| 2003 | 492 | 356 | 479 | 469 | 567 | 563 | 531 | 507 | 529 | 526 | 457 | 438 |
| 2004 | 464 | 437 | 538 | 515 | 535 | 533 | 527 | 562 | 521 | 524 | 430 | 434 |
| 2005 | 462 | 415 | 503 | 476 | 547 | 475 | 504 | 516 | 441 | 476 | 428 | 384 |
| 2006 | 492 | 371 | 518 | 561 | 555 | 517 | 568 | 535 | 512 | 546 | 497 | 467 |
| 2007 | 425 | 425 | 528 | 565 | 568 | 520 | 537 | 546 | 538 | 524 | 561 | 509 |
| 2008 | 489 | 539 | 604 | 621 | 686 | 658 | 489 | 671 | 676 | 602 | 678 | 528 |
| 2009 | 684 | 566 | 761 | 743 | 839 | 768 | 808 | 791 | 725 | 735 | 733 | 677 |
| 2010 | 848 | 685 | 726 | 743 | 742 | 841 | 662 | 744 | 838 | 891 | 694 | 850 |
| 2011 | 734 | 691 | 769 | 791 | 851 | 769 | 873 | 828 | 705 | 802 | 749 | 699 |
| 2012 | 794 | 663 | 798 | 689 | 820 | 795 | 814 | 922 | 842 | 939 | 797 | 743 |
| 2013 | 717 | 779 | 828 | 913 | 1,047 | 1,033 | 1,153 | 1,155 | 1,128 | 1,113 | 1,181 | 1,066 |
| 2014 | 1,106 | 999 | 1,023 | 1,225 | 1,385 | 1,297 | 1,396 | 1,536 | 1,498 | 1,517 | 1,458 | 1,480 |
| 2015 | 1,572 | 1,349 | 1,772 | 1,587 | 1,698 | 1,726 | 1,873 | 1,718 | 1,845 | 1,885 | 1,847 | 2,189 |
| 2016 | 1,993 | 1,696 | 1,967 | 2,005 | 1,957 | 2,208 | 2,132 | 2,135 | 2,002 | 1,940 | 2,114 | 2,296 |
| 2017 | 2,000 | 1,805 | 2,004 | 2,090 | 2,194 | 2,053 | 2,244 | 2,295 | 2,259 | 2,244 | 2,197 | 2,336 |
| 2018 | 2,252 | 2,047 | 2,378 | 2,381 | 2,410 | 2,198 | 2,329 | 2,403 | 2,456 | 2,374 | 2,381 | 2,453 |
| 2019 | 2,342 | 2,124 | 2,300 | 2,425 | 2,573 | 2,423 | 2,498 | 2,296 | 2,462 | 2,469 | 2,529 | 2,661 |
| 2020 | 3,097 | 2,956 | 3,295 | 3,321 | 2,766 | 2,643 | 3,137 | 3,139 | 3,128 | 3,224 | 3,201 | 3,104 |
| 2021 | 3,359 | 2,701 | 3,095 | 3,206 | 3,288 | 2,799 | 3,356 | 3,474 | 3,265 | 3,939 | 3,118 | 3,651 |
| 2022 | -- | -- | -- | -- | -- | -- | -- | -- | -- | -- | -- | -- |
| 2023 | -- | -- | -- | -- | -- | -- | -- | -- | -- | -- | -- | -- |
| 2024 | -- | |||||||||||
| - = No Data Reported; -- = Not Applicable; NA = Not Available; W = Withheld to avoid disclosure of individual company data. |
| Release Date: 3/29/2024 |
| Next Release Date: 4/30/2024 |
Referring Pages: