|
Download Data (XLS File) |
|
||||||||
|
||||||||
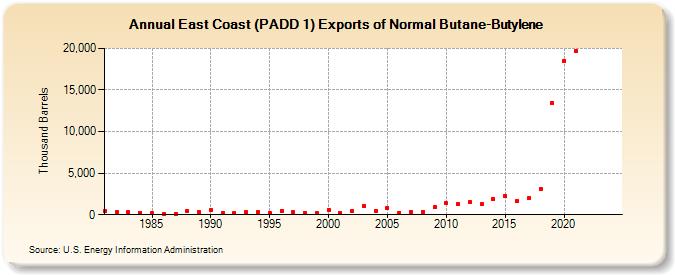
| East Coast (PADD 1) Exports of Normal Butane-Butylene (Thousand Barrels) | ||||||||
| Decade | Year-0 | Year-1 | Year-2 | Year-3 | Year-4 | Year-5 | Year-6 | Year-7 | Year-8 | Year-9 |
|---|---|---|---|---|---|---|---|---|---|---|
| 1980's | 471 | 347 | 272 | 237 | 155 | 139 | 123 | 471 | 274 | |
| 1990's | 573 | 256 | 232 | 298 | 356 | 186 | 497 | 269 | 240 | 250 |
| 2000's | 578 | 233 | 404 | 1,076 | 460 | 833 | 260 | 378 | 373 | 891 |
| 2010's | 1,369 | 1,263 | 1,507 | 1,237 | 1,902 | 2,237 | 1,619 | 2,001 | 3,109 | 13,425 |
| 2020's | 18,533 | 19,716 | -- | -- | -- |
| - = No Data Reported; -- = Not Applicable; NA = Not Available; W = Withheld to avoid disclosure of individual company data. |
| Release Date: 6/30/2025 |
| Next Release Date: 8/29/2025 |