|
Download Data (XLS File) |
|
||||||||
|
||||||||
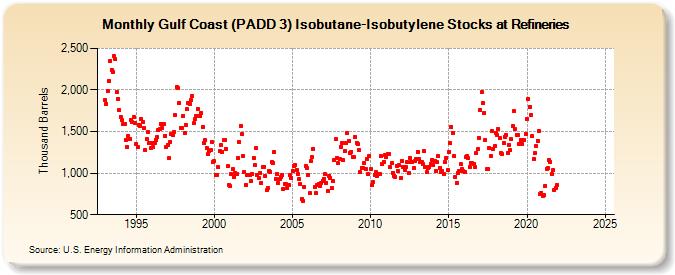
| Gulf Coast (PADD 3) Isobutane-Isobutylene Stocks at Refineries (Thousand Barrels) | ||||||||
| Year | Jan | Feb | Mar | Apr | May | Jun | Jul | Aug | Sep | Oct | Nov | Dec |
|---|---|---|---|---|---|---|---|---|---|---|---|---|
| 1993 | 1,875 | 1,836 | 1,983 | 2,113 | 2,347 | 2,244 | 2,215 | 2,405 | 2,367 | 1,975 | 1,896 | 1,759 |
| 1994 | 1,678 | 1,635 | 1,594 | 1,590 | 1,404 | 1,319 | 1,444 | 1,414 | 1,638 | 1,616 | 1,677 | 1,598 |
| 1995 | 1,352 | 1,317 | 1,584 | 1,570 | 1,649 | 1,612 | 1,544 | 1,281 | 1,407 | 1,494 | 1,358 | 1,298 |
| 1996 | 1,358 | 1,311 | 1,368 | 1,398 | 1,436 | 1,518 | 1,531 | 1,595 | 1,544 | 1,585 | 1,450 | 1,315 |
| 1997 | 1,342 | 1,181 | 1,379 | 1,470 | 1,461 | 1,497 | 1,697 | 2,036 | 2,020 | 1,849 | 1,540 | 1,546 |
| 1998 | 1,692 | 1,479 | 1,579 | 1,768 | 1,842 | 1,834 | 1,878 | 1,925 | 1,599 | 1,645 | 1,684 | 1,772 |
| 1999 | 1,684 | 1,685 | 1,729 | 1,557 | 1,365 | 1,394 | 1,306 | 1,229 | 1,272 | 1,281 | 1,376 | 1,137 |
| 2000 | 1,141 | 981 | 983 | 1,072 | 1,263 | 1,340 | 1,255 | 1,400 | 1,394 | 1,294 | 1,082 | 859 |
| 2001 | 841 | 984 | 1,045 | 959 | 1,003 | 990 | 1,180 | 1,375 | 1,569 | 1,473 | 1,207 | 1,011 |
| 2002 | 859 | 975 | 972 | 978 | 904 | 984 | 1,182 | 1,093 | 1,300 | 982 | 939 | 1,000 |
| 2003 | 886 | 1,076 | 1,077 | 963 | 792 | 820 | 1,031 | 1,015 | 1,133 | 1,117 | 1,255 | 935 |
| 2004 | 994 | 881 | 927 | 956 | 981 | 814 | 872 | 865 | 821 | 859 | 973 | 944 |
| 2005 | 1,028 | 1,084 | 1,092 | 1,039 | 995 | 926 | 865 | 694 | 669 | 834 | 1,085 | 1,062 |
| 2006 | 977 | 756 | 1,142 | 1,188 | 1,291 | 836 | 758 | 855 | 865 | 843 | 887 | 907 |
| 2007 | 931 | 984 | 885 | 782 | 970 | 946 | 826 | 904 | 1,156 | 1,406 | 1,186 | 1,116 |
| 2008 | 1,174 | 1,316 | 1,367 | 1,152 | 1,264 | 1,367 | 1,482 | 1,387 | 1,243 | 1,260 | 1,197 | 1,195 |
| 2009 | 1,437 | 1,367 | 1,352 | 1,278 | 1,008 | 1,062 | 1,067 | 1,119 | 1,052 | 1,170 | 985 | 1,203 |
| 2010 | 1,052 | 852 | 895 | 976 | 1,010 | 971 | 990 | 985 | 1,205 | 1,104 | 1,138 | 1,223 |
| 2011 | 1,191 | 1,230 | 1,236 | 1,071 | 1,117 | 1,006 | 968 | 956 | 1,089 | 1,024 | 1,093 | 944 |
| 2012 | 1,150 | 1,078 | 1,039 | 1,072 | 1,131 | 1,001 | 1,184 | 1,131 | 1,135 | 1,059 | 1,141 | 1,168 |
| 2013 | 1,260 | 1,166 | 1,133 | 1,138 | 1,104 | 1,262 | 1,077 | 1,008 | 1,059 | 1,068 | 1,107 | 1,163 |
| 2014 | 1,098 | 1,144 | 1,024 | 1,128 | 1,205 | 1,066 | 1,012 | 1,022 | 995 | 1,129 | 1,185 | 1,037 |
| 2015 | 1,259 | 1,362 | 1,552 | 1,483 | 1,209 | 958 | 881 | 1,002 | 1,027 | 1,108 | 1,048 | 1,028 |
| 2016 | 1,008 | 1,188 | 1,206 | 1,179 | 1,075 | 1,126 | 1,118 | 1,106 | 1,076 | 1,241 | 1,286 | 1,424 |
| 2017 | 1,761 | 1,972 | 1,839 | 1,726 | 1,403 | 1,046 | 1,050 | 1,303 | 1,209 | 1,508 | 1,293 | 1,326 |
| 2018 | 1,487 | 1,461 | 1,532 | 1,425 | 1,243 | 1,230 | 1,367 | 1,438 | 1,463 | 1,246 | 1,343 | 1,275 |
| 2019 | 1,405 | 1,565 | 1,744 | 1,526 | 1,454 | 1,460 | 1,356 | 1,400 | 1,351 | 1,393 | 1,395 | 1,475 |
| 2020 | 1,653 | 1,891 | 1,800 | 1,697 | 1,441 | 1,171 | 1,242 | 1,325 | 1,392 | 1,511 | 755 | 767 |
| 2021 | 731 | 732 | 847 | 1,055 | 1,062 | 1,156 | 1,134 | 987 | 1,032 | 799 | 827 | 860 |
| 2022 | -- | -- | -- | -- | -- | -- | -- | -- | -- | -- | -- | -- |
| 2023 | -- | -- | -- | -- | -- | -- | -- | -- | -- | -- | -- | -- |
| 2024 | -- | -- | -- | -- | -- | -- | -- | -- | -- | -- | -- | -- |
| 2025 | -- | -- | -- | -- | ||||||||
| - = No Data Reported; -- = Not Applicable; NA = Not Available; W = Withheld to avoid disclosure of individual company data. |
| Release Date: 6/30/2025 |
| Next Release Date: 7/31/2025 |