|
Download Data (XLS File) |
|
||||||||
|
||||||||
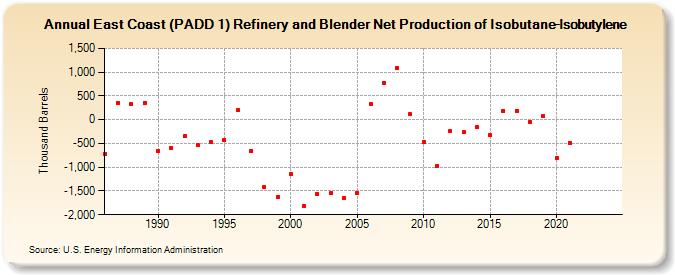
| East Coast (PADD 1) Refinery and Blender Net Production of Isobutane-Isobutylene (Thousand Barrels) | ||||||||
| Decade | Year-0 | Year-1 | Year-2 | Year-3 | Year-4 | Year-5 | Year-6 | Year-7 | Year-8 | Year-9 |
|---|---|---|---|---|---|---|---|---|---|---|
| 1980's | -719 | 356 | 335 | 360 | ||||||
| 1990's | -651 | -586 | -352 | -542 | -475 | -422 | 203 | -663 | -1,417 | -1,623 |
| 2000's | -1,149 | -1,810 | -1,563 | -1,539 | -1,646 | -1,544 | 330 | 769 | 1,086 | 110 |
| 2010's | -464 | -975 | -248 | -267 | -161 | -333 | 191 | 193 | -40 | 86 |
| 2020's | -810 | -482 | -- | -- |
| - = No Data Reported; -- = Not Applicable; NA = Not Available; W = Withheld to avoid disclosure of individual company data. |
| Release Date: 6/28/2024 |
| Next Release Date: 8/30/2024 |