|
Download Data (XLS File) |
|
||||||||
|
||||||||
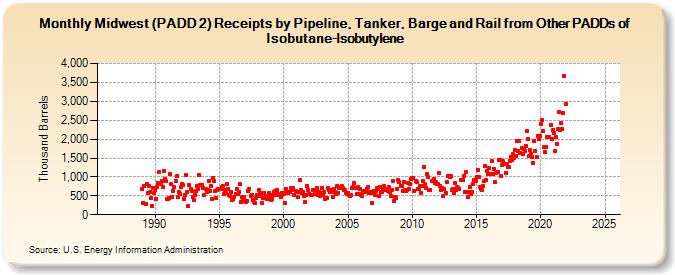
| Midwest (PADD 2) Receipts by Pipeline, Tanker, Barge and Rail from Other PADDs of Isobutane-Isobutylene (Thousand Barrels) | ||||||||
| Year | Jan | Feb | Mar | Apr | May | Jun | Jul | Aug | Sep | Oct | Nov | Dec |
|---|---|---|---|---|---|---|---|---|---|---|---|---|
| 1986 | -- | -- | -- | -- | -- | -- | -- | -- | -- | -- | -- | -- |
| 1987 | -- | -- | -- | -- | -- | -- | -- | -- | -- | -- | -- | -- |
| 1988 | -- | -- | -- | -- | -- | -- | -- | -- | -- | -- | -- | -- |
| 1989 | 682 | 322 | 766 | 277 | 822 | 574 | 768 | 606 | 429 | 234 | 708 | 580 |
| 1990 | 665 | 428 | 723 | 840 | 1,140 | 820 | 889 | 722 | 1,145 | 955 | 885 | 405 |
| 1991 | 420 | 441 | 1,075 | 809 | 459 | 639 | 723 | 886 | 1,012 | 461 | 594 | 554 |
| 1992 | 726 | 811 | 774 | 410 | 511 | 1,040 | 589 | 228 | 799 | 682 | 624 | 464 |
| 1993 | 400 | 529 | 632 | 770 | 681 | 1,062 | 775 | 775 | 791 | 707 | 527 | 673 |
| 1994 | 591 | 656 | 893 | 638 | 755 | 415 | 974 | 880 | 625 | 437 | 659 | 688 |
| 1995 | 692 | 690 | 729 | 753 | 555 | 655 | 567 | 824 | 678 | 521 | 496 | 589 |
| 1996 | 379 | 412 | 480 | 549 | 676 | 554 | 610 | 803 | 325 | 463 | 405 | 472 |
| 1997 | 356 | 335 | 362 | 619 | 683 | 500 | 527 | 399 | 337 | 322 | 440 | 518 |
| 1998 | 492 | 657 | 579 | 487 | 299 | 447 | 579 | 493 | 419 | 478 | 566 | 517 |
| 1999 | 388 | 415 | 509 | 608 | 637 | 530 | 653 | 538 | 510 | 471 | 584 | 575 |
| 2000 | 551 | 309 | 690 | 603 | 582 | 597 | 600 | 700 | 654 | 705 | 527 | 618 |
| 2001 | 600 | 475 | 611 | 909 | 665 | 575 | 604 | 485 | 347 | 528 | 755 | 643 |
| 2002 | 561 | 531 | 511 | 644 | 660 | 552 | 597 | 701 | 522 | 611 | 490 | 583 |
| 2003 | 708 | 516 | 612 | 421 | 436 | 718 | 664 | 609 | 614 | 653 | 476 | 672 |
| 2004 | 589 | 560 | 753 | 577 | 699 | 746 | 757 | 715 | 660 | 651 | 566 | 547 |
| 2005 | 562 | 532 | 504 | 525 | 713 | 744 | 833 | 698 | 544 | 721 | 539 | 693 |
| 2006 | 519 | 502 | 610 | 618 | 596 | 602 | 691 | 727 | 564 | 603 | 316 | 585 |
| 2007 | 638 | 530 | 621 | 711 | 670 | 506 | 732 | 612 | 603 | 708 | 768 | 661 |
| 2008 | 693 | 631 | 743 | 594 | 492 | 657 | 888 | 358 | 477 | 441 | 693 | 911 |
| 2009 | 857 | 765 | 757 | 639 | 869 | 646 | 628 | 662 | 833 | 669 | 802 | 945 |
| 2010 | 980 | 970 | 640 | 894 | 877 | 689 | 688 | 758 | 572 | 758 | 888 | 1,263 |
| 2011 | 801 | 713 | 1,083 | 994 | 644 | 659 | 881 | 898 | 950 | 837 | 856 | 817 |
| 2012 | 802 | 1,092 | 766 | 656 | 694 | 497 | 668 | 585 | 868 | 1,011 | 1,022 | 995 |
| 2013 | 1,035 | 663 | 686 | 585 | 833 | 659 | 730 | 705 | 681 | 928 | 926 | 909 |
| 2014 | 1,019 | 594 | 1,129 | 608 | 470 | 610 | 733 | 536 | 601 | 820 | 909 | 896 |
| 2015 | 994 | 1,192 | 985 | 721 | 689 | 654 | 760 | 898 | 1,277 | 929 | 1,146 | 1,070 |
| 2016 | 1,235 | 1,079 | 1,420 | 1,078 | 1,220 | 864 | 1,099 | 1,128 | 1,126 | 1,452 | 1,447 | 1,013 |
| 2017 | 1,328 | 1,409 | 1,335 | 1,107 | 1,343 | 1,251 | 1,265 | 1,431 | 1,535 | 1,460 | 1,595 | 1,507 |
| 2018 | 1,706 | 1,555 | 1,960 | 1,693 | 1,947 | 1,639 | 1,755 | 1,619 | 1,739 | 1,691 | 1,819 | 2,201 |
| 2019 | 2,015 | 1,545 | 1,705 | 1,612 | 1,537 | 1,379 | 1,955 | 1,684 | 1,515 | 2,091 | 1,995 | 2,089 |
| 2020 | 2,392 | 2,495 | 2,215 | 1,792 | 1,657 | 1,780 | 2,068 | 2,051 | 2,062 | 2,383 | 1,994 | 2,236 |
| 2021 | 2,152 | 1,678 | 2,046 | 1,878 | 2,271 | 2,722 | 2,249 | 2,417 | 2,269 | 2,690 | 3,677 | 2,936 |
| 2022 | -- | -- | -- | -- | -- | -- | -- | -- | -- | -- | -- | -- |
| 2023 | -- | -- | -- | -- | -- | -- | -- | -- | -- | -- | -- | -- |
| 2024 | -- | |||||||||||
| - = No Data Reported; -- = Not Applicable; NA = Not Available; W = Withheld to avoid disclosure of individual company data. |
| Release Date: 3/29/2024 |
| Next Release Date: 4/30/2024 |