|
Download Data (XLS File) |
|
||||||||
|
||||||||
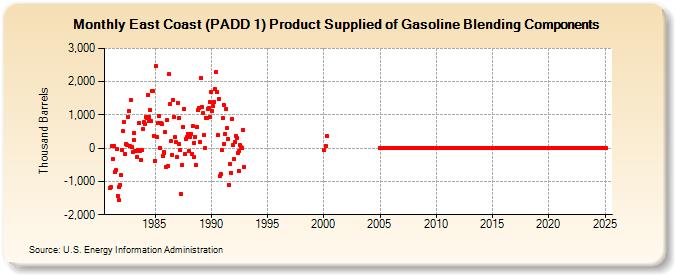
| East Coast (PADD 1) Product Supplied of Gasoline Blending Components (Thousand Barrels) | ||||||||
| Year | Jan | Feb | Mar | Apr | May | Jun | Jul | Aug | Sep | Oct | Nov | Dec |
|---|---|---|---|---|---|---|---|---|---|---|---|---|
| 1981 | -1,209 | -1,167 | 53 | -321 | 73 | -716 | -668 | -19 | -1,433 | -1,563 | -1,174 | -1,099 |
| 1982 | -816 | -52 | 513 | 787 | -177 | 132 | 99 | 934 | 1,118 | 58 | 1,448 | 23 |
| 1983 | -126 | 246 | 449 | -91 | -97 | -255 | -47 | 765 | -70 | -342 | -64 | 584 |
| 1984 | 776 | 729 | 923 | 908 | 1,600 | 936 | 829 | 1,142 | 809 | 1,734 | 1,718 | 377 |
| 1985 | -378 | 2,476 | 333 | 766 | 972 | 19 | 756 | 730 | -243 | -121 | -152 | 476 |
| 1986 | -565 | 852 | -545 | 2,217 | 1,324 | 211 | -193 | 1,458 | 943 | 325 | 182 | -275 |
| 1987 | 1,368 | 901 | 122 | -49 | -1,383 | -513 | 647 | 1,189 | -168 | 267 | 343 | 435 |
| 1988 | -73 | 343 | 424 | -177 | 665 | -251 | 162 | 342 | -509 | 633 | 1,138 | 1,220 |
| 1989 | 195 | 2,122 | 1,237 | 1,045 | 390 | 12 | 922 | 899 | 1,191 | 1,209 | 939 | 1,387 |
| 1990 | 1,704 | 1,122 | 1,261 | 1,399 | 1,766 | 2,290 | 1,689 | 385 | 1,480 | -827 | -766 | -66 |
| 1991 | 894 | 1,307 | 130 | 437 | 1,177 | 607 | 281 | -1,103 | -486 | -731 | 886 | 81 |
| 1992 | -326 | 195 | 378 | 319 | -152 | -672 | -80 | 83 | 32 | -1 | 544 | -559 |
| 2000 | -55 | 73 | 360 | |||||||||
| 2005 | 0 | 0 | 0 | 0 | 0 | 0 | 0 | 0 | 0 | 0 | 0 | 0 |
| 2006 | 0 | 0 | 0 | 0 | 0 | 0 | 0 | 0 | 0 | 0 | 0 | 0 |
| 2007 | 0 | 0 | 0 | 0 | 0 | 0 | 0 | 0 | 0 | 0 | 0 | 0 |
| 2008 | 0 | 0 | 0 | 0 | 0 | 0 | 0 | 0 | 0 | 0 | 0 | 0 |
| 2009 | 0 | 0 | 0 | 0 | 0 | 0 | 0 | 0 | 0 | 0 | 0 | 0 |
| 2010 | 0 | 0 | 0 | 0 | 0 | 0 | 0 | 0 | 0 | 0 | 0 | 0 |
| 2011 | 0 | 0 | 0 | 0 | 0 | 0 | 0 | 0 | 0 | 0 | 0 | 0 |
| 2012 | 0 | 0 | 0 | 0 | 0 | 0 | 0 | 0 | 0 | 0 | 0 | 0 |
| 2013 | 0 | 0 | 0 | 0 | 0 | 0 | 0 | 0 | 0 | 0 | 0 | 0 |
| 2014 | 0 | 0 | 0 | 0 | 0 | 0 | 0 | 0 | 0 | 0 | 0 | 0 |
| 2015 | 0 | 0 | 0 | 0 | 0 | 0 | 0 | 0 | 0 | 0 | 0 | 0 |
| 2016 | 0 | 0 | 0 | 0 | 0 | 0 | 0 | 0 | 0 | 0 | 0 | 0 |
| 2017 | 0 | 0 | 0 | 0 | 0 | 0 | 0 | 0 | 0 | 0 | 0 | 0 |
| 2018 | 0 | 0 | 0 | 0 | 0 | 0 | 0 | 0 | 0 | 0 | 0 | 0 |
| 2019 | 0 | 0 | 0 | 0 | 0 | 0 | 0 | 0 | 0 | 0 | 0 | 0 |
| 2020 | 0 | 0 | 0 | 0 | 0 | 0 | 0 | 0 | 0 | 0 | 0 | 0 |
| 2021 | 0 | 0 | 0 | 0 | 0 | 0 | 0 | 0 | 0 | 0 | 0 | 0 |
| 2022 | 0 | 0 | 0 | 0 | 0 | 0 | 0 | 0 | 0 | 0 | 0 | 0 |
| 2023 | 0 | 0 | 0 | 0 | 0 | 0 | 0 | 0 | 0 | 0 | 0 | 0 |
| 2024 | 0 | |||||||||||
| - = No Data Reported; -- = Not Applicable; NA = Not Available; W = Withheld to avoid disclosure of individual company data. |
| Release Date: 3/29/2024 |
| Next Release Date: 4/30/2024 |