|
Download Data (XLS File) |
|
||||||||
|
||||||||
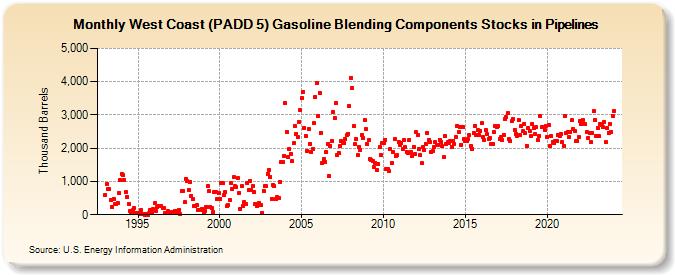
| West Coast (PADD 5) Gasoline Blending Components Stocks in Pipelines (Thousand Barrels) | ||||||||
| Year | Jan | Feb | Mar | Apr | May | Jun | Jul | Aug | Sep | Oct | Nov | Dec |
|---|---|---|---|---|---|---|---|---|---|---|---|---|
| 1993 | 603 | 913 | 780 | 768 | 429 | 242 | 483 | 317 | 321 | 358 | 661 | 1,033 |
| 1994 | 1,232 | 1,188 | 1,040 | 684 | 534 | 337 | 111 | 91 | 138 | 209 | 65 | 58 |
| 1995 | 43 | 32 | 130 | 27 | 26 | 4 | 28 | 4 | 49 | 148 | 60 | 159 |
| 1996 | 339 | 122 | 245 | 270 | 253 | 251 | 203 | 208 | 44 | 50 | 101 | 58 |
| 1997 | 56 | 78 | 71 | 98 | 66 | 116 | 151 | 15 | 713 | 718 | 371 | 1,084 |
| 1998 | 1,009 | 750 | 995 | 573 | 480 | 271 | 249 | 286 | 150 | 148 | 147 | 182 |
| 1999 | 62 | 98 | 242 | 877 | 702 | 241 | 193 | 83 | 693 | 676 | 463 | 648 |
| 2000 | 482 | 958 | 955 | 585 | 678 | 264 | 280 | 455 | 962 | 773 | 1,120 | 851 |
| 2001 | 827 | 1,089 | 667 | 164 | 850 | 259 | 368 | 322 | 956 | 746 | 1,028 | 752 |
| 2002 | 849 | 693 | 336 | 271 | 281 | 356 | 286 | 62 | 722 | 851 | 854 | 1,224 |
| 2003 | 1,355 | 1,139 | 484 | 907 | 857 | 476 | 523 | 508 | 994 | 1,591 | 1,578 | 1,777 |
| 2004 | 3,357 | 2,487 | 1,730 | 1,973 | 1,836 | 1,608 | 2,144 | 2,672 | 2,431 | 2,326 | 2,788 | 3,133 |
| 2005 | 3,514 | 3,690 | 2,609 | 2,373 | 1,920 | 2,577 | 2,139 | 1,890 | 1,980 | 2,755 | 3,553 | 3,947 |
| 2006 | 2,961 | 3,671 | 2,468 | 1,549 | 1,662 | 1,589 | 1,890 | 2,115 | 1,167 | 2,066 | 2,229 | 3,088 |
| 2007 | 2,915 | 3,347 | 1,787 | 1,869 | 2,060 | 2,204 | 2,168 | 2,152 | 2,276 | 2,382 | 2,440 | 3,263 |
| 2008 | 4,122 | 3,808 | 2,660 | 2,119 | 2,266 | 1,781 | 2,047 | 1,934 | 2,408 | 2,308 | 2,848 | 2,573 |
| 2009 | 2,125 | 2,247 | 1,668 | 1,658 | 1,605 | 1,434 | 1,558 | 1,347 | 1,539 | 2,032 | 1,794 | 2,159 |
| 2010 | 2,161 | 2,246 | 1,372 | 1,378 | 1,307 | 1,972 | 1,558 | 1,877 | 2,267 | 1,762 | 1,785 | 2,175 |
| 2011 | 2,086 | 2,141 | 1,975 | 2,249 | 2,029 | 1,900 | 1,849 | 2,246 | 1,897 | 1,771 | 2,043 | 1,813 |
| 2012 | 2,477 | 2,401 | 1,976 | 1,784 | 1,542 | 2,042 | 1,945 | 2,126 | 2,463 | 2,243 | 2,193 | 1,890 |
| 2013 | 1,904 | 2,029 | 2,180 | 2,089 | 2,107 | 2,260 | 2,198 | 2,065 | 1,727 | 2,359 | 2,122 | 2,179 |
| 2014 | 2,158 | 2,221 | 2,044 | 2,219 | 2,120 | 2,351 | 2,677 | 2,488 | 2,642 | 2,104 | 2,644 | 2,264 |
| 2015 | 2,207 | 2,204 | 2,270 | 2,384 | 2,073 | 1,971 | 2,451 | 2,675 | 2,411 | 2,535 | 2,387 | 2,522 |
| 2016 | 2,748 | 2,327 | 2,244 | 2,543 | 2,415 | 2,273 | 2,319 | 2,117 | 2,127 | 2,479 | 2,652 | 2,627 |
| 2017 | 2,659 | 2,272 | 2,328 | 2,237 | 2,395 | 2,877 | 2,936 | 3,065 | 2,264 | 2,211 | 2,803 | 2,872 |
| 2018 | 2,555 | 2,418 | 2,377 | 2,846 | 2,402 | 2,664 | 2,505 | 2,730 | 2,445 | 2,080 | 2,600 | 2,507 |
| 2019 | 2,366 | 2,738 | 2,615 | 2,441 | 2,629 | 2,237 | 2,368 | 2,970 | 2,644 | 2,630 | 2,533 | 2,671 |
| 2020 | 2,342 | 2,705 | 2,074 | 2,363 | 2,194 | 2,158 | 2,208 | 2,211 | 2,391 | 2,357 | 2,431 | 2,180 |
| 2021 | 2,075 | 2,955 | 2,460 | 2,490 | 2,322 | 2,489 | 2,839 | 2,583 | 2,527 | 2,212 | 2,205 | 2,334 |
| 2022 | 2,821 | 2,729 | 2,843 | 2,735 | 2,718 | 2,495 | 2,308 | 2,465 | 2,177 | 2,446 | 3,113 | 2,851 |
| 2023 | 2,353 | 2,605 | 2,353 | 2,735 | 2,693 | 2,628 | 2,786 | 2,175 | 2,610 | 2,467 | 2,733 | 2,493 |
| 2024 | 2,971 | |||||||||||
| - = No Data Reported; -- = Not Applicable; NA = Not Available; W = Withheld to avoid disclosure of individual company data. |
| Release Date: 3/29/2024 |
| Next Release Date: 4/30/2024 |