|
Download Data (XLS File) |
|
||||||||
|
||||||||
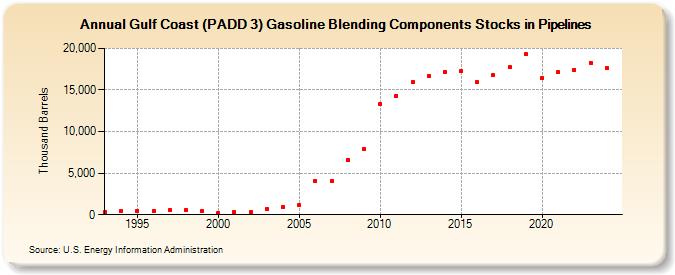
| Gulf Coast (PADD 3) Gasoline Blending Components Stocks in Pipelines (Thousand Barrels) | ||||||||
| Decade | Year-0 | Year-1 | Year-2 | Year-3 | Year-4 | Year-5 | Year-6 | Year-7 | Year-8 | Year-9 |
|---|---|---|---|---|---|---|---|---|---|---|
| 1990's | 302 | 483 | 499 | 465 | 555 | 547 | 460 | |||
| 2000's | 199 | 337 | 293 | 687 | 972 | 1,168 | 4,080 | 4,082 | 6,587 | 7,929 |
| 2010's | 13,314 | 14,330 | 15,912 | 16,673 | 17,202 | 17,243 | 15,922 | 16,773 | 17,730 | 19,271 |
| 2020's | 16,465 | 17,137 | 17,436 | 18,750 |
| - = No Data Reported; -- = Not Applicable; NA = Not Available; W = Withheld to avoid disclosure of individual company data. |
| Release Date: 3/29/2024 |
| Next Release Date: 8/30/2024 |