|
Download Data (XLS File) |
|
||||||||
|
||||||||
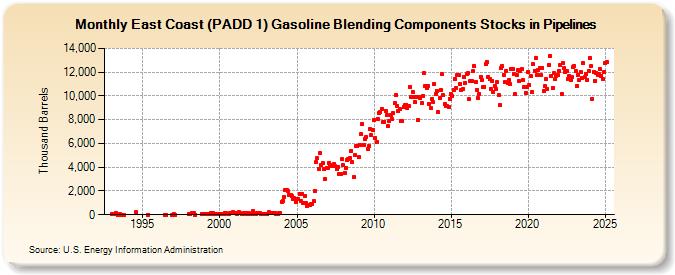
| East Coast (PADD 1) Gasoline Blending Components Stocks in Pipelines (Thousand Barrels) | ||||||||
| Year | Jan | Feb | Mar | Apr | May | Jun | Jul | Aug | Sep | Oct | Nov | Dec |
|---|---|---|---|---|---|---|---|---|---|---|---|---|
| 1993 | 75 | 75 | 75 | 148 | 2 | 55 | 3 | 5 | 2 | |||
| 1994 | 228 | |||||||||||
| 1995 | 4 | |||||||||||
| 1996 | 7 | 7 | 8 | |||||||||
| 1997 | 76 | 2 | ||||||||||
| 1998 | 22 | 21 | 142 | 133 | 5 | 44 | 66 | |||||
| 1999 | 69 | 77 | 43 | 39 | 46 | 116 | 82 | 129 | 60 | 69 | 76 | 75 |
| 2000 | 53 | 78 | 73 | 86 | 124 | 113 | 74 | 89 | 114 | 104 | 205 | 110 |
| 2001 | 110 | 88 | 127 | 222 | 114 | 82 | 94 | 103 | 138 | 95 | 131 | 90 |
| 2002 | 98 | 104 | 289 | 79 | 96 | 146 | 136 | 124 | 91 | 94 | 97 | 85 |
| 2003 | 99 | 60 | 200 | 120 | 123 | 132 | 126 | 113 | 98 | 101 | 103 | 106 |
| 2004 | 1,101 | 1,195 | 1,493 | 2,043 | 2,060 | 1,973 | 1,678 | 1,682 | 1,559 | 1,340 | 1,392 | 1,086 |
| 2005 | 1,292 | 1,325 | 1,780 | 1,145 | 1,761 | 999 | 1,576 | 1,002 | 762 | 785 | 813 | 876 |
| 2006 | 902 | 1,122 | 2,037 | 4,447 | 4,739 | 3,848 | 5,188 | 4,184 | 4,391 | 3,840 | 3,017 | 3,933 |
| 2007 | 3,892 | 4,359 | 4,205 | 4,103 | 4,180 | 4,297 | 4,084 | 3,841 | 4,039 | 3,425 | 3,455 | 4,653 |
| 2008 | 4,168 | 3,549 | 3,903 | 4,564 | 4,710 | 4,756 | 5,386 | 4,421 | 3,179 | 5,000 | 5,759 | 5,805 |
| 2009 | 4,840 | 5,847 | 6,769 | 7,674 | 5,871 | 6,355 | 6,526 | 5,559 | 5,764 | 7,222 | 6,673 | 7,092 |
| 2010 | 7,999 | 6,467 | 6,084 | 8,078 | 8,553 | 8,643 | 8,934 | 7,778 | 7,829 | 8,759 | 8,387 | 7,465 |
| 2011 | 7,874 | 8,410 | 8,016 | 8,544 | 9,363 | 10,048 | 9,183 | 8,746 | 8,913 | 7,914 | 7,852 | 9,101 |
| 2012 | 9,232 | 9,270 | 8,977 | 9,110 | 10,783 | 9,940 | 10,333 | 9,926 | 9,483 | 9,919 | 7,982 | 9,906 |
| 2013 | 9,829 | 9,370 | 9,972 | 11,946 | 10,866 | 10,695 | 10,874 | 9,302 | 8,998 | 9,753 | 9,469 | 11,021 |
| 2014 | 10,149 | 10,444 | 8,637 | 9,802 | 10,522 | 11,805 | 10,037 | 9,310 | 9,165 | 9,139 | 9,108 | 9,781 |
| 2015 | 10,157 | 9,985 | 10,512 | 11,431 | 10,696 | 11,775 | 11,721 | 10,987 | 10,466 | 10,555 | 11,627 | 11,087 |
| 2016 | 11,819 | 11,948 | 9,722 | 11,227 | 11,244 | 12,096 | 12,499 | 11,136 | 10,514 | 9,819 | 10,186 | 11,625 |
| 2017 | 11,313 | 10,771 | 10,779 | 12,656 | 12,852 | 11,624 | 11,403 | 10,607 | 11,276 | 10,290 | 10,875 | 10,578 |
| 2018 | 11,158 | 10,065 | 9,199 | 12,345 | 12,501 | 11,800 | 11,154 | 12,100 | 11,064 | 11,334 | 10,992 | 12,269 |
| 2019 | 12,279 | 11,856 | 10,134 | 11,763 | 12,178 | 11,233 | 12,063 | 12,259 | 11,320 | 10,741 | 10,277 | 10,770 |
| 2020 | 12,030 | 10,925 | 11,639 | 10,294 | 12,644 | 12,126 | 13,230 | 11,800 | 12,183 | 12,337 | 11,733 | 12,381 |
| 2021 | 10,432 | 10,826 | 11,388 | 10,595 | 12,620 | 13,368 | 11,715 | 10,701 | 11,907 | 11,388 | 11,689 | 11,766 |
| 2022 | 12,111 | 12,609 | 10,196 | 12,758 | 12,328 | 12,017 | 12,131 | 11,430 | 11,703 | 11,311 | 11,603 | 12,408 |
| 2023 | 12,532 | 12,072 | 10,847 | 11,790 | 11,319 | 12,019 | 11,476 | 12,749 | 11,589 | 11,830 | 11,380 | 12,110 |
| 2024 | 13,219 | |||||||||||
| - = No Data Reported; -- = Not Applicable; NA = Not Available; W = Withheld to avoid disclosure of individual company data. |
| Release Date: 3/29/2024 |
| Next Release Date: 4/30/2024 |