|
Download Data (XLS File) |
|
||||||||
|
||||||||
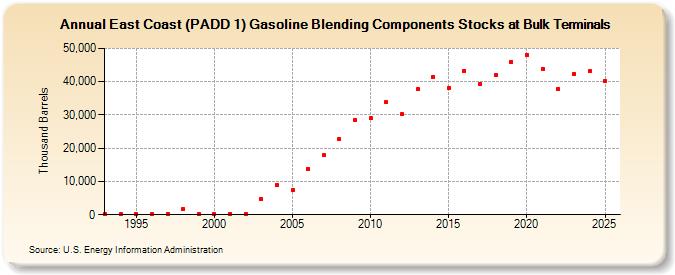
| East Coast (PADD 1) Gasoline Blending Components Stocks at Bulk Terminals (Thousand Barrels) | ||||||||
| Decade | Year-0 | Year-1 | Year-2 | Year-3 | Year-4 | Year-5 | Year-6 | Year-7 | Year-8 | Year-9 |
|---|---|---|---|---|---|---|---|---|---|---|
| 1990's | 218 | 118 | 84 | 150 | 287 | 1,785 | 187 | |||
| 2000's | 284 | 302 | 229 | 4,779 | 8,808 | 7,414 | 13,823 | 17,812 | 22,801 | 28,559 |
| 2010's | 28,933 | 33,743 | 30,173 | 37,708 | 41,499 | 38,157 | 43,282 | 39,258 | 41,915 | 46,007 |
| 2020's | 48,074 | 43,865 | 37,862 | 42,436 |
| - = No Data Reported; -- = Not Applicable; NA = Not Available; W = Withheld to avoid disclosure of individual company data. |
| Release Date: 4/30/2024 |
| Next Release Date: 8/30/2024 |