|
Download Data (XLS File) |
|
||||||||
|
||||||||
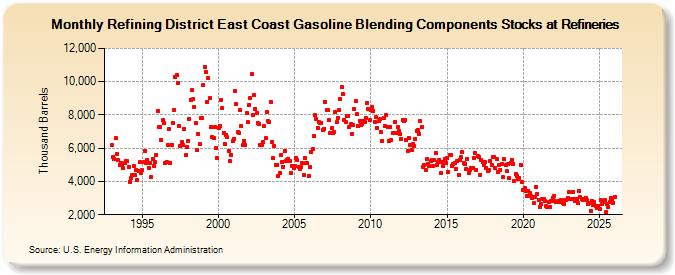
| Refining District East Coast Gasoline Blending Components Stocks at Refineries (Thousand Barrels) | ||||||||
| Year | Jan | Feb | Mar | Apr | May | Jun | Jul | Aug | Sep | Oct | Nov | Dec |
|---|---|---|---|---|---|---|---|---|---|---|---|---|
| 1993 | 6,201 | 5,478 | 5,365 | 6,590 | 5,669 | 5,284 | 5,003 | 5,130 | 4,995 | 4,781 | 5,080 | 5,257 |
| 1994 | 5,210 | 4,873 | 3,995 | 4,209 | 4,382 | 4,921 | 4,398 | 4,698 | 4,083 | 4,601 | 5,145 | 4,531 |
| 1995 | 4,687 | 5,162 | 5,834 | 5,096 | 5,296 | 4,817 | 5,121 | 4,284 | 5,379 | 4,955 | 5,153 | 5,609 |
| 1996 | 8,226 | 7,279 | 7,251 | 6,483 | 7,670 | 7,498 | 5,092 | 5,178 | 6,185 | 7,167 | 5,110 | 6,211 |
| 1997 | 7,541 | 8,320 | 10,255 | 10,379 | 9,928 | 7,319 | 6,117 | 6,353 | 6,186 | 7,151 | 5,561 | 6,071 |
| 1998 | 6,434 | 7,778 | 8,915 | 9,508 | 8,975 | 8,491 | 7,528 | 5,868 | 6,871 | 6,224 | 7,799 | 7,801 |
| 1999 | 9,805 | 10,874 | 10,579 | 8,787 | 10,215 | 8,999 | 7,282 | 6,654 | 6,615 | 7,251 | 6,026 | 5,433 |
| 2000 | 7,226 | 7,306 | 8,923 | 8,393 | 6,941 | 6,276 | 6,811 | 6,657 | 5,851 | 5,212 | 5,561 | 6,418 |
| 2001 | 6,573 | 9,435 | 8,641 | 6,982 | 6,942 | 8,307 | 7,312 | 6,168 | 6,428 | 6,168 | 8,112 | 7,558 |
| 2002 | 8,616 | 8,989 | 10,460 | 8,007 | 9,191 | 8,384 | 8,134 | 7,509 | 7,441 | 6,171 | 6,214 | 6,356 |
| 2003 | 7,321 | 6,602 | 8,187 | 7,620 | 7,596 | 8,765 | 6,392 | 5,391 | 6,102 | 5,013 | 4,997 | 4,343 |
| 2004 | 4,516 | 5,577 | 5,188 | 4,889 | 5,809 | 5,220 | 5,270 | 5,373 | 5,218 | 4,531 | 4,944 | 4,833 |
| 2005 | 4,922 | 5,433 | 5,285 | 4,898 | 4,751 | 4,890 | 5,100 | 4,364 | 5,436 | 5,108 | 5,121 | 4,322 |
| 2006 | 4,867 | 5,742 | 5,922 | 6,732 | 7,976 | 7,741 | 7,242 | 7,549 | 7,519 | 7,533 | 7,087 | 7,164 |
| 2007 | 8,765 | 8,291 | 8,301 | 7,677 | 6,894 | 7,189 | 6,897 | 6,991 | 8,178 | 7,548 | 7,829 | 8,307 |
| 2008 | 8,960 | 9,674 | 9,254 | 7,706 | 7,587 | 7,957 | 7,942 | 7,246 | 7,433 | 6,873 | 7,419 | 8,344 |
| 2009 | 8,824 | 8,037 | 7,327 | 7,647 | 7,421 | 7,467 | 7,608 | 7,580 | 7,833 | 8,725 | 8,333 | 7,700 |
| 2010 | 8,277 | 8,462 | 8,231 | 7,604 | 7,854 | 7,225 | 7,614 | 7,725 | 6,947 | 6,430 | 7,789 | 7,337 |
| 2011 | 7,981 | 7,290 | 6,411 | 7,268 | 6,494 | 6,884 | 6,912 | 7,602 | 6,886 | 7,303 | 7,037 | 6,855 |
| 2012 | 6,581 | 7,689 | 7,629 | 7,724 | 6,467 | 5,860 | 6,609 | 6,212 | 5,862 | 6,236 | 6,132 | 6,561 |
| 2013 | 7,024 | 7,116 | 6,880 | 7,627 | 7,296 | 4,874 | 4,997 | 4,708 | 5,344 | 5,074 | 4,942 | 5,202 |
| 2014 | 5,274 | 4,920 | 5,292 | 5,701 | 5,017 | 5,153 | 5,281 | 4,501 | 5,174 | 4,901 | 5,326 | 5,086 |
| 2015 | 5,396 | 4,594 | 5,594 | 5,577 | 4,957 | 5,064 | 5,117 | 4,739 | 5,200 | 4,395 | 5,314 | 5,445 |
| 2016 | 5,795 | 5,139 | 5,073 | 4,753 | 5,378 | 4,481 | 4,712 | 4,808 | 4,795 | 5,393 | 5,697 | 4,693 |
| 2017 | 5,512 | 5,441 | 4,404 | 5,261 | 5,165 | 4,981 | 5,161 | 4,815 | 4,647 | 4,715 | 5,244 | 4,996 |
| 2018 | 5,469 | 5,476 | 4,796 | 5,327 | 4,555 | 5,002 | 4,710 | 5,035 | 4,257 | 5,320 | 4,960 | 4,606 |
| 2019 | 5,058 | 4,186 | 5,096 | 5,313 | 5,057 | 4,019 | 4,432 | 4,352 | 4,175 | 4,201 | 5,000 | 3,963 |
| 2020 | 3,480 | 3,624 | 3,420 | 3,124 | 3,439 | 3,314 | 3,108 | 3,005 | 2,675 | 3,080 | 3,643 | 3,274 |
| 2021 | 2,889 | 2,452 | 2,618 | 2,923 | 2,964 | 2,852 | 2,503 | 2,474 | 2,761 | 2,479 | 2,798 | 3,014 |
| 2022 | 3,142 | 2,808 | 2,779 | 2,773 | 2,836 | 2,763 | 2,887 | 2,705 | 2,658 | 2,884 | 2,914 | 2,992 |
| 2023 | 3,370 | 2,920 | 2,932 | 3,346 | 2,970 | 2,814 | 2,936 | 2,699 | 3,429 | 3,038 | 2,926 | 2,876 |
| 2024 | 2,926 | |||||||||||
| - = No Data Reported; -- = Not Applicable; NA = Not Available; W = Withheld to avoid disclosure of individual company data. |
| Release Date: 3/29/2024 |
| Next Release Date: 4/30/2024 |