|
Download Data (XLS File) |
|
||||||||
|
||||||||
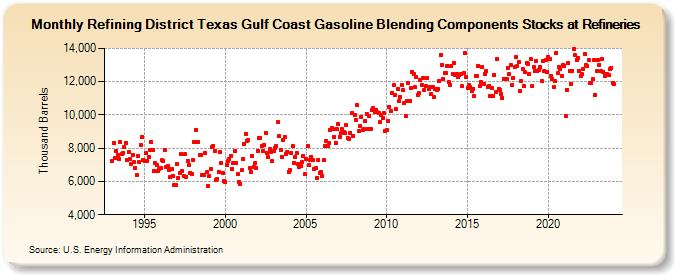
| Refining District Texas Gulf Coast Gasoline Blending Components Stocks at Refineries (Thousand Barrels) | ||||||||
| Year | Jan | Feb | Mar | Apr | May | Jun | Jul | Aug | Sep | Oct | Nov | Dec |
|---|---|---|---|---|---|---|---|---|---|---|---|---|
| 1993 | 7,252 | 8,306 | 7,407 | 7,819 | 7,613 | 7,339 | 8,369 | 7,667 | 7,712 | 8,044 | 8,316 | 7,285 |
| 1994 | 7,773 | 7,340 | 7,074 | 7,611 | 7,163 | 6,811 | 6,408 | 7,532 | 7,150 | 8,185 | 8,701 | 7,314 |
| 1995 | 7,250 | 7,685 | 7,208 | 7,460 | 7,895 | 8,364 | 7,911 | 6,614 | 7,086 | 6,987 | 6,612 | 6,732 |
| 1996 | 6,807 | 7,269 | 7,231 | 7,880 | 6,844 | 6,902 | 6,694 | 6,244 | 6,756 | 6,298 | 5,791 | 5,797 |
| 1997 | 7,075 | 6,229 | 6,529 | 7,643 | 6,625 | 6,321 | 7,642 | 6,283 | 7,247 | 6,964 | 6,535 | 6,435 |
| 1998 | 7,296 | 8,385 | 9,121 | 8,376 | 8,373 | 7,561 | 7,602 | 6,364 | 6,381 | 7,703 | 6,543 | 5,749 |
| 1999 | 6,356 | 6,760 | 8,062 | 8,136 | 7,817 | 6,091 | 6,154 | 6,555 | 7,743 | 7,115 | 6,532 | 6,023 |
| 2000 | 5,984 | 6,989 | 7,235 | 7,359 | 7,552 | 6,771 | 7,107 | 7,859 | 7,089 | 6,449 | 5,959 | 5,869 |
| 2001 | 6,673 | 7,341 | 8,245 | 8,872 | 8,462 | 8,491 | 6,797 | 6,583 | 7,546 | 6,896 | 7,116 | 6,794 |
| 2002 | 7,836 | 8,593 | 8,629 | 8,138 | 7,809 | 8,198 | 8,902 | 7,708 | 7,498 | 7,941 | 7,783 | 7,201 |
| 2003 | 7,815 | 8,010 | 8,109 | 9,568 | 8,705 | 7,889 | 7,487 | 8,474 | 8,688 | 7,661 | 7,773 | 6,577 |
| 2004 | 6,689 | 7,706 | 8,139 | 7,135 | 7,476 | 7,723 | 7,072 | 6,878 | 6,913 | 7,180 | 7,512 | 6,424 |
| 2005 | 7,377 | 8,114 | 6,979 | 7,288 | 7,493 | 7,314 | 6,748 | 6,808 | 6,217 | 7,316 | 6,531 | 6,573 |
| 2006 | 6,336 | 7,274 | 8,115 | 8,439 | 8,122 | 8,323 | 9,087 | 9,216 | 9,142 | 8,660 | 8,302 | 9,132 |
| 2007 | 9,455 | 8,693 | 8,933 | 9,126 | 8,983 | 8,916 | 9,378 | 8,617 | 8,547 | 8,930 | 10,095 | 8,743 |
| 2008 | 9,983 | 9,716 | 10,576 | 9,018 | 9,304 | 9,903 | 9,072 | 9,138 | 9,605 | 10,083 | 9,138 | 9,953 |
| 2009 | 9,132 | 10,266 | 10,389 | 10,155 | 10,308 | 10,155 | 10,102 | 9,593 | 9,995 | 9,801 | 10,086 | 9,034 |
| 2010 | 9,084 | 9,650 | 10,501 | 10,240 | 11,317 | 11,789 | 11,199 | 10,361 | 11,569 | 10,823 | 11,071 | 11,816 |
| 2011 | 11,486 | 10,693 | 9,921 | 10,828 | 11,911 | 10,823 | 11,591 | 12,604 | 12,459 | 11,650 | 12,257 | 11,205 |
| 2012 | 11,305 | 12,089 | 11,809 | 12,193 | 11,516 | 11,722 | 12,213 | 11,537 | 11,662 | 11,242 | 11,707 | 11,068 |
| 2013 | 11,569 | 11,508 | 11,573 | 12,058 | 13,618 | 13,009 | 12,175 | 12,512 | 12,548 | 12,963 | 11,971 | 11,828 |
| 2014 | 12,925 | 12,462 | 13,123 | 12,416 | 12,471 | 12,306 | 12,379 | 12,441 | 11,718 | 12,526 | 13,720 | 12,295 |
| 2015 | 11,621 | 11,784 | 11,658 | 11,467 | 11,547 | 11,158 | 12,330 | 12,335 | 12,964 | 11,743 | 11,998 | 12,895 |
| 2016 | 11,862 | 12,436 | 12,621 | 11,689 | 11,722 | 11,114 | 11,648 | 11,121 | 12,401 | 11,360 | 13,384 | 11,575 |
| 2017 | 11,486 | 11,231 | 11,043 | 12,163 | 12,137 | 12,165 | 12,851 | 12,456 | 13,018 | 11,798 | 12,225 | 12,863 |
| 2018 | 13,466 | 12,940 | 13,168 | 11,422 | 12,011 | 12,742 | 11,717 | 12,565 | 13,151 | 13,063 | 12,431 | 13,377 |
| 2019 | 11,742 | 12,882 | 12,659 | 13,228 | 12,637 | 12,714 | 12,898 | 12,053 | 13,246 | 12,641 | 13,291 | 12,594 |
| 2020 | 13,512 | 13,366 | 12,351 | 12,149 | 11,672 | 12,023 | 13,743 | 12,501 | 12,907 | 12,738 | 12,359 | 13,019 |
| 2021 | 12,959 | 9,949 | 11,514 | 13,142 | 12,628 | 11,881 | 12,661 | 13,952 | 13,590 | 13,305 | 13,432 | 12,667 |
| 2022 | 12,315 | 12,440 | 12,772 | 13,672 | 13,000 | 12,928 | 13,289 | 11,915 | 11,907 | 12,144 | 13,304 | 11,195 |
| 2023 | 12,635 | 13,332 | 13,022 | 12,611 | 13,391 | 12,603 | 12,328 | 12,464 | 12,449 | 12,371 | 12,731 | 12,847 |
| 2024 | 11,914 | |||||||||||
| - = No Data Reported; -- = Not Applicable; NA = Not Available; W = Withheld to avoid disclosure of individual company data. |
| Release Date: 3/29/2024 |
| Next Release Date: 4/30/2024 |