|
Download Data (XLS File) |
|
||||||||
|
||||||||
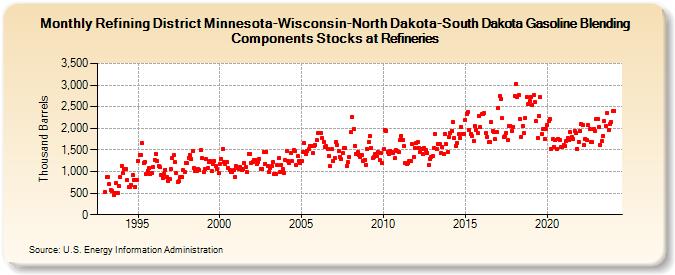
| Refining District Minnesota-Wisconsin-North Dakota-South Dakota Gasoline Blending Components Stocks at Refineries (Thousand Barrels) | ||||||||
| Year | Jan | Feb | Mar | Apr | May | Jun | Jul | Aug | Sep | Oct | Nov | Dec |
|---|---|---|---|---|---|---|---|---|---|---|---|---|
| 1993 | 521 | 866 | 875 | 709 | 570 | 547 | 461 | 504 | 734 | 514 | 655 | 874 |
| 1994 | 1,134 | 968 | 1,068 | 1,067 | 793 | 640 | 646 | 688 | 910 | 814 | 649 | 801 |
| 1995 | 1,247 | 1,384 | 1,392 | 1,656 | 1,206 | 1,230 | 950 | 1,019 | 1,075 | 937 | 976 | 1,105 |
| 1996 | 1,268 | 1,414 | 1,252 | 1,137 | 1,097 | 924 | 860 | 940 | 1,041 | 878 | 782 | 821 |
| 1997 | 1,049 | 1,301 | 1,375 | 1,217 | 967 | 763 | 774 | 863 | 884 | 1,026 | 992 | 1,204 |
| 1998 | 1,194 | 1,320 | 1,384 | 1,291 | 1,483 | 1,090 | 1,013 | 1,020 | 1,054 | 1,032 | 1,496 | 1,301 |
| 1999 | 981 | 1,056 | 1,284 | 1,081 | 1,225 | 1,249 | 1,003 | 1,175 | 1,242 | 1,126 | 1,062 | 965 |
| 2000 | 1,178 | 1,287 | 1,512 | 1,227 | 1,176 | 1,218 | 1,092 | 1,045 | 997 | 1,000 | 1,029 | 883 |
| 2001 | 1,117 | 1,079 | 1,053 | 1,108 | 1,045 | 1,067 | 1,195 | 1,109 | 984 | 1,415 | 1,407 | 1,189 |
| 2002 | 1,230 | 1,257 | 1,273 | 1,170 | 1,228 | 1,300 | 1,069 | 1,067 | 1,455 | 1,180 | 1,458 | 1,129 |
| 2003 | 990 | 1,086 | 1,131 | 1,214 | 936 | 933 | 1,147 | 1,303 | 986 | 1,162 | 1,052 | 962 |
| 2004 | 1,262 | 1,483 | 1,239 | 1,192 | 1,431 | 1,233 | 1,487 | 1,469 | 1,144 | 1,348 | 1,252 | 1,206 |
| 2005 | 1,253 | 1,460 | 1,652 | 1,408 | 1,472 | 1,526 | 1,597 | 1,581 | 1,425 | 1,589 | 1,621 | 1,727 |
| 2006 | 1,888 | 1,883 | 1,887 | 1,770 | 1,693 | 1,570 | 1,581 | 1,528 | 1,356 | 1,118 | 1,511 | 1,246 |
| 2007 | 1,324 | 1,680 | 1,607 | 1,480 | 1,347 | 1,289 | 1,421 | 1,536 | 1,544 | 1,127 | 1,212 | 1,333 |
| 2008 | 1,905 | 2,272 | 1,984 | 1,597 | 1,413 | 1,447 | 1,378 | 1,347 | 1,371 | 1,253 | 1,268 | 1,156 |
| 2009 | 1,517 | 1,694 | 1,826 | 1,545 | 1,303 | 1,333 | 1,407 | 1,365 | 1,450 | 1,277 | 1,425 | 1,192 |
| 2010 | 1,511 | 1,966 | 1,947 | 1,452 | 1,396 | 1,470 | 1,451 | 1,422 | 1,301 | 1,496 | 1,464 | 1,449 |
| 2011 | 1,723 | 1,832 | 1,732 | 1,596 | 1,188 | 1,181 | 1,196 | 1,241 | 1,239 | 1,636 | 1,345 | 1,538 |
| 2012 | 1,649 | 1,679 | 1,550 | 1,454 | 1,513 | 1,414 | 1,539 | 1,498 | 1,431 | 1,146 | 1,300 | 1,338 |
| 2013 | 1,355 | 1,546 | 1,865 | 1,531 | 1,635 | 1,644 | 1,431 | 1,572 | 1,394 | 1,878 | 1,626 | 1,457 |
| 2014 | 1,803 | 1,894 | 1,940 | 2,136 | 1,771 | 1,586 | 1,669 | 1,861 | 1,777 | 2,041 | 1,878 | 1,877 |
| 2015 | 2,187 | 2,334 | 2,374 | 1,961 | 1,878 | 1,823 | 1,706 | 2,048 | 1,972 | 1,901 | 2,284 | 2,021 |
| 2016 | 2,328 | 2,334 | 2,349 | 1,894 | 1,802 | 1,672 | 1,688 | 2,138 | 1,942 | 1,913 | 1,745 | 1,918 |
| 2017 | 2,473 | 2,743 | 2,681 | 2,228 | 1,790 | 1,813 | 1,887 | 1,727 | 2,048 | 2,054 | 1,938 | 2,039 |
| 2018 | 2,739 | 3,029 | 2,732 | 2,769 | 2,205 | 1,810 | 2,064 | 1,885 | 2,249 | 2,728 | 2,571 | 2,622 |
| 2019 | 2,734 | 2,531 | 2,762 | 2,603 | 2,159 | 1,780 | 2,292 | 2,730 | 1,869 | 1,977 | 1,742 | 1,990 |
| 2020 | 2,068 | 2,158 | 2,207 | 1,518 | 1,756 | 1,573 | 1,736 | 1,521 | 1,758 | 1,727 | 1,567 | 1,570 |
| 2021 | 1,624 | 1,597 | 1,711 | 1,767 | 1,740 | 1,903 | 1,804 | 1,752 | 1,936 | 1,880 | 1,530 | 1,692 |
| 2022 | 1,936 | 2,104 | 2,067 | 1,606 | 1,762 | 1,740 | 2,067 | 1,977 | 1,681 | 1,679 | 1,989 | 1,935 |
| 2023 | 2,222 | 2,216 | 2,028 | 1,617 | 1,704 | 1,830 | 2,174 | 2,063 | 2,351 | 1,952 | 2,096 | 2,153 |
| 2024 | 2,391 | |||||||||||
| - = No Data Reported; -- = Not Applicable; NA = Not Available; W = Withheld to avoid disclosure of individual company data. |
| Release Date: 3/29/2024 |
| Next Release Date: 4/30/2024 |