|
Download Data (XLS File) |
|
||||||||
|
||||||||
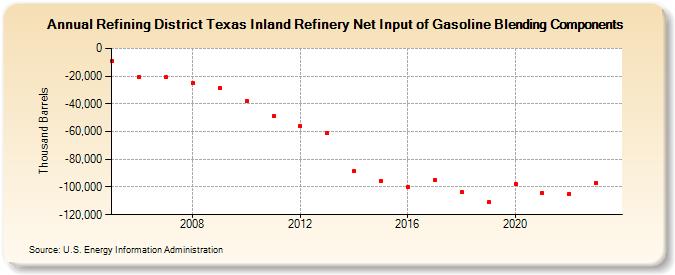
| Refining District Texas Inland Refinery Net Input of Gasoline Blending Components (Thousand Barrels) | ||||||||
| Decade | Year-0 | Year-1 | Year-2 | Year-3 | Year-4 | Year-5 | Year-6 | Year-7 | Year-8 | Year-9 |
|---|---|---|---|---|---|---|---|---|---|---|
| 2000's | -9,369 | -20,660 | -20,931 | -25,145 | -28,425 | |||||
| 2010's | -37,796 | -48,890 | -55,693 | -61,097 | -88,627 | -95,567 | -99,987 | -94,733 | -103,556 | -111,051 |
| 2020's | -97,730 | -104,159 | -105,013 | -97,156 |
| - = No Data Reported; -- = Not Applicable; NA = Not Available; W = Withheld to avoid disclosure of individual company data. |
| Release Date: 3/29/2024 |
| Next Release Date: 8/30/2024 |