|
Download Data (XLS File) |
|
||||||||
|
||||||||
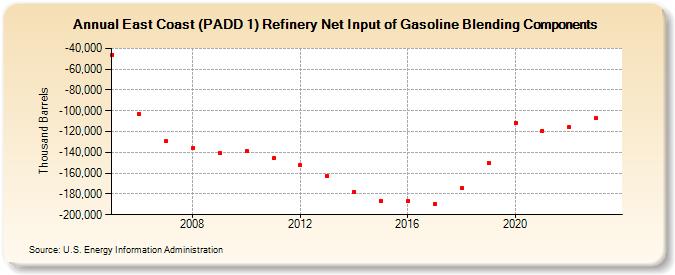
| East Coast (PADD 1) Refinery Net Input of Gasoline Blending Components (Thousand Barrels) | ||||||||
| Decade | Year-0 | Year-1 | Year-2 | Year-3 | Year-4 | Year-5 | Year-6 | Year-7 | Year-8 | Year-9 |
|---|---|---|---|---|---|---|---|---|---|---|
| 2000's | -45,906 | -103,310 | -129,458 | -136,107 | -140,749 | |||||
| 2010's | -138,544 | -145,698 | -152,505 | -162,932 | -177,673 | -186,735 | -186,951 | -189,453 | -174,452 | -149,830 |
| 2020's | -111,724 | -119,096 | -115,949 | -107,374 |
| - = No Data Reported; -- = Not Applicable; NA = Not Available; W = Withheld to avoid disclosure of individual company data. |
| Release Date: 6/28/2024 |
| Next Release Date: 8/30/2024 |