|
Download Data (XLS File) |
|
||||||||
|
||||||||
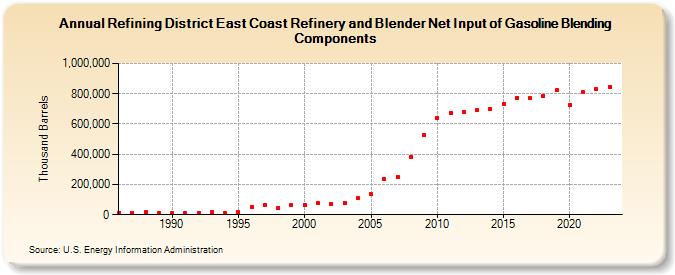
| Refining District East Coast Refinery and Blender Net Input of Gasoline Blending Components (Thousand Barrels) | ||||||||
| Decade | Year-0 | Year-1 | Year-2 | Year-3 | Year-4 | Year-5 | Year-6 | Year-7 | Year-8 | Year-9 |
|---|---|---|---|---|---|---|---|---|---|---|
| 1980's | 13,828 | 13,773 | 16,346 | 9,941 | ||||||
| 1990's | 9,778 | 10,315 | 11,240 | 15,093 | 9,210 | 15,551 | 52,167 | 63,790 | 46,339 | 63,169 |
| 2000's | 64,399 | 74,627 | 72,325 | 77,844 | 107,548 | 136,680 | 233,177 | 251,367 | 384,444 | 527,607 |
| 2010's | 638,491 | 673,139 | 678,873 | 690,544 | 699,224 | 732,588 | 774,208 | 770,278 | 786,261 | 822,218 |
| 2020's | 725,535 | 808,683 | 828,412 | 845,482 |
| - = No Data Reported; -- = Not Applicable; NA = Not Available; W = Withheld to avoid disclosure of individual company data. |
| Release Date: 6/28/2024 |
| Next Release Date: 8/30/2024 |