|
Download Data (XLS File) |
|
||||||||
|
||||||||
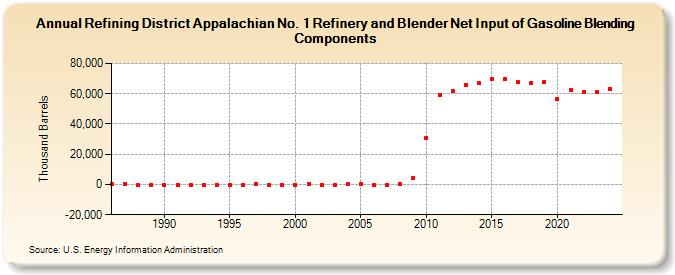
| Refining District Appalachian No. 1 Refinery and Blender Net Input of Gasoline Blending Components (Thousand Barrels) | ||||||||
| Decade | Year-0 | Year-1 | Year-2 | Year-3 | Year-4 | Year-5 | Year-6 | Year-7 | Year-8 | Year-9 |
|---|---|---|---|---|---|---|---|---|---|---|
| 1980's | 46 | -19 | -205 | -234 | ||||||
| 1990's | -128 | -96 | -196 | -134 | -148 | -78 | -175 | -13 | -29 | -100 |
| 2000's | -87 | -16 | -70 | -43 | -3 | -12 | -23 | -34 | 2 | 4,282 |
| 2010's | 30,909 | 58,858 | 61,763 | 65,610 | 67,169 | 69,667 | 69,544 | 67,466 | 67,106 | 67,631 |
| 2020's | 56,272 | 62,429 | 61,314 | 60,940 |
| - = No Data Reported; -- = Not Applicable; NA = Not Available; W = Withheld to avoid disclosure of individual company data. |
| Release Date: 6/28/2024 |
| Next Release Date: 8/30/2024 |