|
Download Data (XLS File) |
|
||||||||
|
||||||||
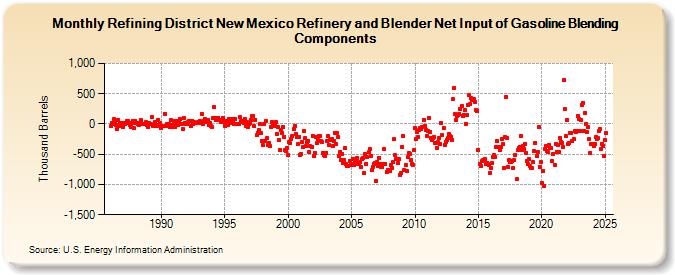
| Refining District New Mexico Refinery and Blender Net Input of Gasoline Blending Components (Thousand Barrels) | ||||||||
| Year | Jan | Feb | Mar | Apr | May | Jun | Jul | Aug | Sep | Oct | Nov | Dec |
|---|---|---|---|---|---|---|---|---|---|---|---|---|
| 1986 | -36 | 18 | 5 | 78 | 49 | -15 | -89 | 70 | -26 | 10 | -36 | 20 |
| 1987 | -58 | 6 | 23 | 57 | 41 | 14 | -19 | -52 | 8 | 57 | -71 | 55 |
| 1988 | 12 | 24 | -5 | -17 | 17 | 59 | -6 | -4 | -5 | 28 | -15 | -55 |
| 1989 | 16 | -5 | -4 | 123 | -28 | -41 | 28 | -20 | -29 | 59 | -23 | 11 |
| 1990 | -69 | -28 | -41 | 172 | -28 | 0 | -32 | 3 | -54 | 60 | -9 | -53 |
| 1991 | 42 | -51 | -10 | 56 | -21 | 33 | 82 | -4 | -84 | 100 | 12 | -7 |
| 1992 | 2 | 30 | 42 | 54 | -41 | 53 | -3 | 36 | 14 | 18 | 23 | 31 |
| 1993 | 56 | 13 | 165 | 7 | 50 | 78 | 55 | 31 | 69 | -22 | 15 | -41 |
| 1994 | -52 | 92 | 284 | 106 | 60 | 64 | 104 | 65 | 40 | 71 | 95 | 36 |
| 1995 | -29 | 47 | 45 | -22 | 88 | 24 | 65 | 76 | 47 | -2 | 84 | -7 |
| 1996 | 5 | -3 | 111 | 44 | 31 | 56 | 11 | 85 | -27 | 31 | -52 | 3 |
| 1997 | 18 | 67 | 136 | 129 | -41 | 72 | -189 | -146 | -100 | 1 | -150 | -279 |
| 1998 | -352 | 3 | -274 | 50 | -235 | -345 | -317 | -366 | -52 | 28 | -21 | -28 |
| 1999 | 26 | -165 | -52 | -258 | -434 | -94 | -143 | -51 | -210 | -437 | -448 | -391 |
| 2000 | -510 | -302 | -319 | -248 | -199 | -79 | -34 | -164 | -213 | -336 | -221 | -506 |
| 2001 | -500 | -290 | -386 | -109 | -237 | -362 | -305 | -281 | -471 | -372 | -383 | -194 |
| 2002 | -536 | -476 | -218 | -307 | -261 | -201 | -203 | -278 | -292 | -472 | -518 | -523 |
| 2003 | -475 | -280 | -205 | -349 | -258 | -246 | -368 | -287 | -142 | -333 | -157 | -209 |
| 2004 | -533 | -456 | -588 | -495 | -640 | -601 | -393 | -664 | -702 | -698 | -607 | -678 |
| 2005 | -666 | -571 | -684 | -615 | -608 | -558 | -662 | -646 | -621 | -719 | -583 | -556 |
| 2006 | -809 | -498 | -657 | -553 | -468 | -414 | -532 | -766 | -712 | -655 | -641 | -940 |
| 2007 | -624 | -689 | -557 | -654 | -706 | -713 | -665 | -419 | -655 | -790 | -756 | -763 |
| 2008 | -782 | -681 | -734 | -635 | -253 | -516 | -581 | -579 | -645 | -585 | -846 | -816 |
| 2009 | -378 | -201 | -762 | -686 | -773 | -549 | -484 | -489 | -599 | -654 | -675 | -438 |
| 2010 | -67 | -253 | -128 | -215 | -107 | -62 | -85 | -53 | 68 | -37 | -95 | -194 |
| 2011 | -112 | 104 | -139 | -232 | -268 | -227 | -212 | -317 | -312 | -393 | -301 | -230 |
| 2012 | -335 | 19 | -184 | -67 | -350 | -305 | -272 | -234 | -171 | -194 | -212 | -263 |
| 2013 | 406 | 599 | 169 | 66 | 128 | 142 | 165 | 241 | 293 | 135 | 144 | 224 |
| 2014 | 7 | 143 | 311 | 474 | 323 | 429 | 391 | 402 | 406 | 362 | 232 | 214 |
| 2015 | -423 | -658 | -698 | -619 | -602 | -589 | -573 | -656 | -641 | -664 | -671 | -807 |
| 2016 | -730 | -649 | -543 | -519 | -549 | -382 | -286 | -382 | -430 | -378 | -256 | -336 |
| 2017 | -729 | -209 | 447 | -239 | -705 | -592 | -636 | -630 | -616 | -730 | -593 | -505 |
| 2018 | -916 | -431 | -396 | -375 | -197 | -432 | -369 | -412 | -325 | -475 | -610 | -666 |
| 2019 | -579 | -700 | -731 | -736 | -632 | -451 | -307 | -526 | -456 | -54 | -707 | -634 |
| 2020 | -975 | -770 | -1,021 | -407 | -366 | -451 | -471 | -349 | -400 | -396 | -617 | -495 |
| 2021 | -677 | -326 | -458 | -351 | -468 | -239 | -293 | -312 | -386 | 724 | 243 | -206 |
| 2022 | 70 | -333 | -320 | -151 | -152 | -287 | -252 | -117 | -131 | -112 | 134 | 80 |
| 2023 | -78 | 91 | 328 | 369 | -115 | 177 | 5 | -129 | -53 | -254 | -482 | -326 |
| 2024 | -325 | |||||||||||
| - = No Data Reported; -- = Not Applicable; NA = Not Available; W = Withheld to avoid disclosure of individual company data. |
| Release Date: 3/29/2024 |
| Next Release Date: 4/30/2024 |