|
Download Data (XLS File) |
|
||||||||
|
||||||||
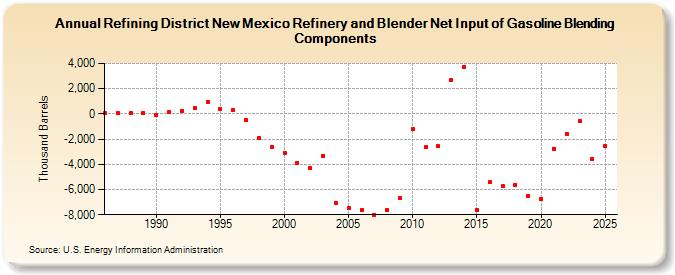
| Refining District New Mexico Refinery and Blender Net Input of Gasoline Blending Components (Thousand Barrels) | ||||||||
| Decade | Year-0 | Year-1 | Year-2 | Year-3 | Year-4 | Year-5 | Year-6 | Year-7 | Year-8 | Year-9 |
|---|---|---|---|---|---|---|---|---|---|---|
| 1980's | 48 | 61 | 33 | 87 | ||||||
| 1990's | -79 | 148 | 259 | 476 | 965 | 416 | 295 | -482 | -1,909 | -2,657 |
| 2000's | -3,131 | -3,890 | -4,285 | -3,309 | -7,055 | -7,489 | -7,645 | -7,991 | -7,653 | -6,688 |
| 2010's | -1,228 | -2,639 | -2,568 | 2,712 | 3,694 | -7,601 | -5,440 | -5,737 | -5,604 | -6,513 |
| 2020's | -6,718 | -2,749 | -1,571 | -467 |
| - = No Data Reported; -- = Not Applicable; NA = Not Available; W = Withheld to avoid disclosure of individual company data. |
| Release Date: 3/29/2024 |
| Next Release Date: 8/30/2024 |