|
Download Data (XLS File) |
|
||||||||
|
||||||||
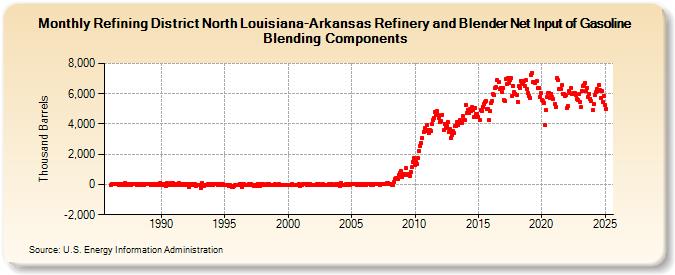
| Refining District North Louisiana-Arkansas Refinery and Blender Net Input of Gasoline Blending Components (Thousand Barrels) | ||||||||
| Year | Jan | Feb | Mar | Apr | May | Jun | Jul | Aug | Sep | Oct | Nov | Dec |
|---|---|---|---|---|---|---|---|---|---|---|---|---|
| 1986 | -63 | 34 | 45 | 28 | 31 | 1 | 49 | -2 | -31 | -2 | 27 | 45 |
| 1987 | -25 | 8 | 116 | -23 | 63 | 53 | 38 | -32 | 37 | 46 | 30 | -2 |
| 1988 | 60 | -27 | 54 | 7 | -30 | 61 | 49 | -7 | 46 | 36 | 9 | 23 |
| 1989 | 25 | 9 | -36 | 18 | 29 | -8 | -31 | 56 | -13 | 37 | -4 | 90 |
| 1990 | 8 | -21 | 42 | -21 | -95 | 107 | 6 | -19 | -37 | 79 | -25 | 74 |
| 1991 | -14 | 28 | -17 | -2 | 41 | 89 | -6 | 8 | -9 | 33 | -38 | -61 |
| 1992 | 51 | -18 | -170 | 38 | -30 | 7 | 16 | -49 | 29 | -85 | -47 | -24 |
| 1993 | -52 | -228 | 87 | -13 | -118 | -55 | -64 | -62 | 30 | 4 | -24 | -35 |
| 1994 | 31 | -3 | 15 | 29 | 17 | -8 | 7 | -18 | -10 | 11 | -18 | |
| 1995 | -48 | -23 | -9 | -49 | -102 | -62 | -129 | -142 | -175 | -69 | -31 | -14 |
| 1996 | -29 | -41 | 38 | 11 | -182 | 19 | 5 | -44 | -3 | -28 | 45 | |
| 1997 | -60 | 31 | -17 | -56 | -96 | -3 | -83 | 41 | -17 | -81 | 8 | -62 |
| 1998 | 44 | -49 | -60 | -10 | 14 | -40 | 5 | -40 | -7 | -22 | -45 | 18 |
| 1999 | -38 | -11 | -19 | 6 | -48 | -4 | -37 | -6 | -21 | -15 | -19 | -20 |
| 2000 | -29 | -42 | -42 | -46 | -1 | -31 | -21 | -12 | -31 | -12 | 6 | -80 |
| 2001 | -19 | -29 | -1 | 5 | 43 | 22 | -61 | 9 | -35 | 23 | -27 | -20 |
| 2002 | -31 | -5 | -11 | 23 | -68 | 24 | -51 | -21 | -9 | 19 | -59 | -5 |
| 2003 | -22 | -8 | -12 | 45 | -61 | 7 | -17 | -13 | -13 | 23 | -8 | -16 |
| 2004 | 14 | -91 | 87 | -9 | -38 | -19 | 2 | -5 | 2 | -36 | 8 | |
| 2005 | -1 | 12 | 13 | 2 | 32 | -34 | 4 | 35 | -25 | -15 | 31 | -12 |
| 2006 | 26 | -13 | -37 | 11 | -2 | 31 | -50 | 13 | -6 | 12 | 9 | 24 |
| 2007 | 21 | 33 | 44 | -16 | 51 | 14 | 14 | 50 | 34 | 89 | 80 | 48 |
| 2008 | 2 | 51 | -24 | -14 | 176 | 360 | 422 | 373 | 361 | 657 | 787 | 884 |
| 2009 | 507 | 602 | 725 | 1,073 | 657 | 685 | 649 | 589 | 847 | 1,133 | 1,501 | 1,729 |
| 2010 | 1,262 | 1,510 | 1,386 | 1,749 | 2,199 | 2,521 | 2,770 | 3,080 | 3,490 | 3,710 | 3,555 | 3,905 |
| 2011 | 3,589 | 3,384 | 3,580 | 3,548 | 4,015 | 4,290 | 4,415 | 4,809 | 4,580 | 4,850 | 4,571 | 4,421 |
| 2012 | 4,139 | 4,182 | 4,623 | 3,572 | 4,020 | 3,756 | 3,848 | 4,146 | 3,446 | 3,689 | 3,079 | 3,256 |
| 2013 | 3,509 | 3,432 | 3,873 | 3,877 | 4,118 | 3,923 | 4,039 | 4,251 | 4,094 | 4,511 | 4,249 | 4,258 |
| 2014 | 5,272 | 4,733 | 4,931 | 4,727 | 5,011 | 4,844 | 5,106 | 4,956 | 4,443 | 5,076 | 4,635 | 4,684 |
| 2015 | 4,482 | 4,233 | 4,904 | 4,870 | 5,136 | 5,322 | 5,446 | 5,510 | 4,992 | 4,962 | 4,235 | 4,829 |
| 2016 | 5,389 | 5,545 | 5,978 | 5,909 | 6,382 | 6,458 | 6,880 | 6,767 | 6,302 | 6,395 | 6,144 | 6,380 |
| 2017 | 5,583 | 5,552 | 6,975 | 6,627 | 7,019 | 6,730 | 6,884 | 7,007 | 5,882 | 6,534 | 6,106 | 5,999 |
| 2018 | 5,936 | 5,481 | 6,483 | 6,406 | 6,857 | 6,680 | 6,673 | 6,809 | 6,520 | 6,882 | 6,292 | 6,044 |
| 2019 | 5,863 | 5,704 | 7,249 | 7,400 | 6,765 | 6,777 | 6,713 | 6,840 | 6,375 | 6,371 | 5,786 | 6,029 |
| 2020 | 5,567 | 5,518 | 5,411 | 3,915 | 4,940 | 5,769 | 6,018 | 6,047 | 5,721 | 6,013 | 5,778 | 5,636 |
| 2021 | 5,341 | 5,154 | 7,038 | 6,930 | 6,307 | 6,296 | 6,311 | 6,549 | 5,993 | 6,014 | 5,826 | 5,890 |
| 2022 | 5,079 | 5,161 | 6,158 | 6,019 | 6,392 | 5,981 | 6,039 | 6,071 | 5,887 | 5,671 | 5,582 | 5,971 |
| 2023 | 5,466 | 5,095 | 6,189 | 6,500 | 6,589 | 6,707 | 6,162 | 6,439 | 5,803 | 6,012 | 5,677 | 5,498 |
| 2024 | 4,919 | 5,289 | 5,934 | 6,089 | ||||||||
| - = No Data Reported; -- = Not Applicable; NA = Not Available; W = Withheld to avoid disclosure of individual company data. |
| Release Date: 6/28/2024 |
| Next Release Date: 7/31/2024 |