|
Download Data (XLS File) |
|
||||||||
|
||||||||
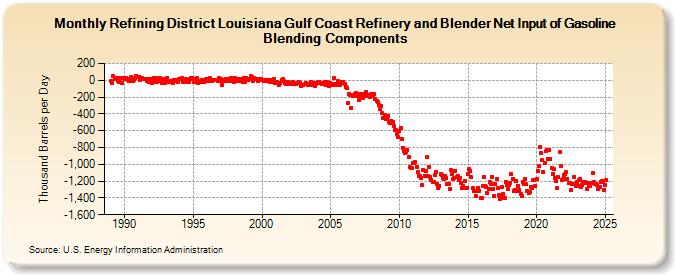
| Refining District Louisiana Gulf Coast Refinery and Blender Net Input of Gasoline Blending Components (Thousand Barrels per Day) | ||||||||
| Year | Jan | Feb | Mar | Apr | May | Jun | Jul | Aug | Sep | Oct | Nov | Dec |
|---|---|---|---|---|---|---|---|---|---|---|---|---|
| 1989 | -7 | -38 | 48 | 15 | 10 | 23 | -3 | -15 | 23 | -31 | 25 | 32 |
| 1990 | 11 | 24 | 13 | 3 | -10 | 40 | -5 | -11 | 3 | 32 | 49 | 41 |
| 1991 | 40 | 5 | 29 | 27 | 21 | 12 | 13 | -8 | 19 | -26 | 11 | 11 |
| 1992 | -35 | 23 | -21 | 23 | -18 | -8 | -9 | 22 | -28 | 14 | -8 | -34 |
| 1993 | 2 | 32 | -18 | -24 | -13 | -9 | -28 | 0 | -13 | 4 | -18 | 18 |
| 1994 | 12 | 10 | 25 | -20 | -6 | 10 | -19 | -2 | -26 | 15 | 27 | 24 |
| 1995 | -24 | 11 | -20 | 23 | -29 | -19 | -4 | 6 | -17 | -25 | 2 | 12 |
| 1996 | 13 | -6 | 22 | -7 | -11 | 8 | 9 | 7 | -1 | -5 | 24 | -9 |
| 1997 | 15 | -58 | -4 | 6 | 11 | -7 | 18 | 6 | -6 | 26 | -2 | -21 |
| 1998 | 24 | 11 | -3 | 18 | 14 | -14 | 17 | -24 | 27 | -19 | 29 | 12 |
| 1999 | 0 | 18 | 50 | 34 | -6 | 23 | 11 | 14 | -6 | 4 | 20 | 20 |
| 2000 | 4 | 9 | -10 | 3 | -12 | 3 | -14 | -25 | 8 | -19 | 21 | -28 |
| 2001 | -35 | -26 | -33 | -56 | -37 | 4 | 11 | -8 | -32 | -43 | -46 | -20 |
| 2002 | -31 | -49 | -50 | -22 | -37 | -42 | -42 | -34 | -16 | -31 | -65 | -52 |
| 2003 | -57 | -48 | -33 | -42 | -58 | -44 | -40 | -18 | -58 | -34 | -70 | -43 |
| 2004 | -33 | -24 | -18 | -32 | -46 | -44 | -34 | -16 | -58 | -16 | -70 | -32 |
| 2005 | -39 | -62 | -42 | 22 | -43 | -54 | -12 | -28 | -52 | -35 | -24 | -21 |
| 2006 | -40 | -77 | -96 | -274 | -161 | -173 | -324 | -186 | -180 | -165 | -155 | -190 |
| 2007 | -169 | -232 | -187 | -159 | -210 | -188 | -162 | -139 | -185 | -174 | -195 | -169 |
| 2008 | -166 | -183 | -166 | -225 | -241 | -263 | -293 | -341 | -301 | -392 | -445 | -417 |
| 2009 | -462 | -453 | -422 | -499 | -510 | -479 | -491 | -539 | -596 | -592 | -642 | -677 |
| 2010 | -604 | -570 | -698 | -802 | -846 | -868 | -858 | -835 | -919 | -1,032 | -1,041 | -1,048 |
| 2011 | -985 | -990 | -977 | -1,033 | -1,097 | -1,140 | -1,137 | -1,166 | -1,241 | -1,063 | -1,136 | -1,082 |
| 2012 | -919 | -1,139 | -1,035 | -1,146 | -1,184 | -1,207 | -1,205 | -1,126 | -1,092 | -1,232 | -1,284 | -1,255 |
| 2013 | -1,119 | -1,123 | -1,160 | -1,171 | -1,141 | -1,161 | -1,237 | -1,240 | -1,295 | -1,072 | -1,116 | -1,172 |
| 2014 | -1,162 | -1,078 | -1,150 | -1,136 | -1,182 | -1,166 | -1,219 | -1,277 | -1,260 | -1,198 | -1,283 | -1,280 |
| 2015 | -1,120 | -1,057 | -1,075 | -1,156 | -1,286 | -1,322 | -1,312 | -1,378 | -1,318 | -1,279 | -1,314 | -1,399 |
| 2016 | -1,402 | -1,264 | -1,157 | -1,260 | -1,270 | -1,347 | -1,298 | -1,216 | -1,232 | -1,148 | -1,290 | -1,377 |
| 2017 | -1,238 | -1,170 | -1,286 | -1,370 | -1,414 | -1,396 | -1,270 | -1,350 | -1,399 | -1,206 | -1,245 | -1,295 |
| 2018 | -1,246 | -1,220 | -1,110 | -1,177 | -1,314 | -1,301 | -1,193 | -1,322 | -1,254 | -1,307 | -1,348 | -1,376 |
| 2019 | -1,214 | -1,234 | -1,172 | -1,236 | -1,313 | -1,336 | -1,332 | -1,271 | -1,286 | -1,189 | -1,192 | -1,253 |
| 2020 | -1,169 | -1,075 | -1,026 | -793 | -865 | -952 | -1,089 | -988 | -843 | -826 | -933 | -826 |
| 2021 | -938 | -1,044 | -1,114 | -1,057 | -1,164 | -1,201 | -1,281 | -1,156 | -858 | -1,023 | -1,186 | -1,173 |
| 2022 | -1,122 | -1,119 | -1,096 | -1,170 | -1,227 | -1,222 | -1,302 | -1,232 | -1,234 | -1,146 | -1,260 | -1,205 |
| 2023 | -1,264 | -1,188 | -1,172 | -1,270 | -1,252 | -1,208 | -1,211 | -1,224 | -1,292 | -1,220 | -1,255 | -1,258 |
| 2024 | -1,223 | |||||||||||
| - = No Data Reported; -- = Not Applicable; NA = Not Available; W = Withheld to avoid disclosure of individual company data. |
| Release Date: 3/29/2024 |
| Next Release Date: 4/30/2024 |