|
Download Data (XLS File) |
|
||||||||
|
||||||||
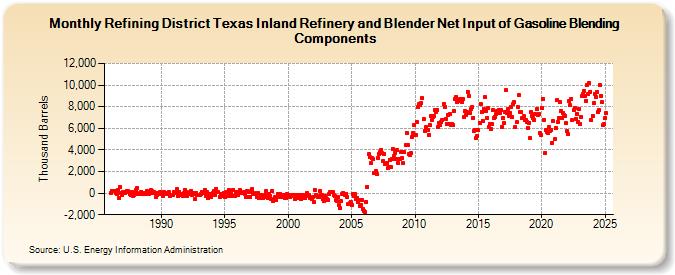
| Refining District Texas Inland Refinery and Blender Net Input of Gasoline Blending Components (Thousand Barrels) | ||||||||
| Year | Jan | Feb | Mar | Apr | May | Jun | Jul | Aug | Sep | Oct | Nov | Dec |
|---|---|---|---|---|---|---|---|---|---|---|---|---|
| 1986 | 0 | 194 | 169 | 168 | 179 | 45 | -44 | 271 | -440 | 553 | -29 | -194 |
| 1987 | 59 | 2 | 75 | 235 | 230 | 128 | -82 | -174 | 118 | -276 | -135 | -6 |
| 1988 | 288 | 457 | -60 | -91 | -25 | 127 | -121 | 6 | -90 | -116 | 163 | -68 |
| 1989 | -66 | 44 | 289 | 155 | -35 | 89 | -7 | -364 | -175 | 26 | -38 | 128 |
| 1990 | -99 | -290 | 140 | 53 | 13 | -45 | -4 | 112 | -265 | -174 | -156 | -130 |
| 1991 | 116 | 45 | 33 | 348 | -250 | 146 | -202 | -115 | -310 | -14 | 324 | 149 |
| 1992 | -308 | -76 | -47 | 98 | 205 | -189 | 20 | -97 | -572 | 32 | -184 | -164 |
| 1993 | -205 | -75 | 93 | 59 | 22 | 308 | -306 | 69 | -480 | -60 | -66 | -344 |
| 1994 | -74 | -15 | 159 | -154 | 383 | 69 | 78 | -333 | -81 | -229 | -232 | 20 |
| 1995 | -404 | 125 | 64 | -238 | 255 | -257 | 17 | -298 | 299 | -236 | -273 | 147 |
| 1996 | -142 | 23 | 325 | 39 | 16 | 49 | 68 | -74 | -318 | 204 | -393 | 126 |
| 1997 | -392 | 216 | 408 | -98 | 6 | -89 | -368 | 48 | -465 | -443 | -183 | -300 |
| 1998 | -480 | -324 | -152 | 172 | -349 | -467 | -57 | -277 | -575 | 192 | -735 | -385 |
| 1999 | -650 | -405 | -37 | -235 | -59 | -383 | -249 | -167 | -329 | -483 | -420 | -79 |
| 2000 | -250 | -219 | -320 | -276 | -136 | -130 | -562 | -394 | -183 | -417 | -188 | -385 |
| 2001 | -587 | -174 | -193 | -346 | -470 | -246 | 15 | -293 | -208 | -472 | -512 | -319 |
| 2002 | -826 | 332 | -219 | -223 | -352 | -392 | 150 | -132 | -155 | -555 | -689 | -222 |
| 2003 | -453 | -577 | -601 | -91 | 76 | 146 | 66 | -156 | -233 | -643 | -687 | -390 |
| 2004 | -1,136 | -1,389 | -760 | -46 | 36 | -71 | -178 | -54 | -369 | -1,030 | -952 | -793 |
| 2005 | -1,146 | -117 | -301 | -118 | -563 | -449 | -795 | -638 | -1,191 | -1,070 | -635 | -1,482 |
| 2006 | -1,673 | -1,733 | -801 | 585 | 3,596 | 3,314 | 2,783 | 3,294 | 3,179 | 1,880 | 1,901 | 2,030 |
| 2007 | 1,731 | 3,296 | 3,624 | 3,782 | 3,998 | 3,699 | 2,968 | 3,623 | 2,714 | 2,778 | 2,295 | 2,445 |
| 2008 | 3,093 | 2,411 | 3,154 | 4,073 | 3,441 | 3,714 | 3,180 | 3,975 | 2,786 | 3,189 | 3,135 | 3,766 |
| 2009 | 3,227 | 2,743 | 3,798 | 4,422 | 5,578 | 4,482 | 3,581 | 3,519 | 3,671 | 5,198 | 5,594 | 6,262 |
| 2010 | 5,382 | 5,412 | 6,541 | 7,954 | 8,239 | 8,121 | 8,351 | 8,766 | 6,821 | 5,774 | 6,083 | 5,799 |
| 2011 | 5,799 | 5,413 | 6,269 | 7,132 | 6,734 | 7,080 | 7,134 | 7,698 | 7,550 | 7,706 | 6,160 | 6,534 |
| 2012 | 6,307 | 6,572 | 6,795 | 8,229 | 7,970 | 6,892 | 6,434 | 7,242 | 6,428 | 7,303 | 6,314 | 6,393 |
| 2013 | 6,319 | 7,635 | 8,690 | 8,935 | 8,407 | 8,598 | 8,485 | 8,727 | 8,453 | 8,723 | 7,017 | 7,567 |
| 2014 | 7,251 | 7,520 | 9,371 | 8,989 | 7,399 | 7,780 | 7,994 | 6,998 | 5,791 | 5,812 | 5,079 | 5,307 |
| 2015 | 5,840 | 6,486 | 8,268 | 7,523 | 6,712 | 7,787 | 8,862 | 7,560 | 6,995 | 7,841 | 6,105 | 6,378 |
| 2016 | 5,977 | 6,397 | 7,649 | 6,929 | 7,091 | 7,363 | 7,615 | 7,707 | 7,416 | 7,715 | 6,147 | 6,916 |
| 2017 | 6,457 | 7,523 | 9,514 | 7,388 | 7,755 | 7,154 | 7,422 | 8,001 | 7,012 | 8,254 | 8,392 | 6,134 |
| 2018 | 6,538 | 7,982 | 9,036 | 7,539 | 7,517 | 6,913 | 6,910 | 7,114 | 6,751 | 6,801 | 6,601 | 6,045 |
| 2019 | 6,496 | 5,111 | 7,522 | 7,179 | 6,954 | 6,795 | 7,368 | 7,746 | 7,259 | 7,309 | 5,546 | 5,398 |
| 2020 | 7,911 | 8,731 | 6,796 | 3,699 | 5,809 | 5,646 | 5,551 | 6,097 | 5,793 | 5,811 | 4,662 | 6,649 |
| 2021 | 4,984 | 6,010 | 8,583 | 6,608 | 6,972 | 8,413 | 7,583 | 6,965 | 7,434 | 7,259 | 7,181 | 6,485 |
| 2022 | 5,741 | 5,468 | 8,486 | 8,119 | 8,758 | 6,813 | 7,664 | 7,833 | 6,885 | 7,339 | 6,612 | 7,750 |
| 2023 | 6,269 | 6,943 | 8,964 | 9,132 | 9,418 | 9,105 | 8,552 | 10,047 | 9,184 | 10,204 | 9,387 | 6,664 |
| 2024 | 7,165 | |||||||||||
| - = No Data Reported; -- = Not Applicable; NA = Not Available; W = Withheld to avoid disclosure of individual company data. |
| Release Date: 3/29/2024 |
| Next Release Date: 4/30/2024 |