|
Download Data (XLS File) |
|
||||||||
|
||||||||
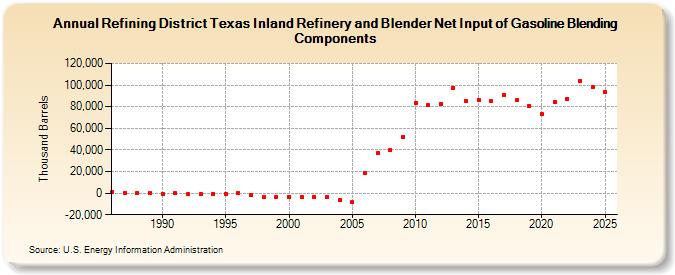
| Refining District Texas Inland Refinery and Blender Net Input of Gasoline Blending Components (Thousand Barrels) | ||||||||
| Decade | Year-0 | Year-1 | Year-2 | Year-3 | Year-4 | Year-5 | Year-6 | Year-7 | Year-8 | Year-9 |
|---|---|---|---|---|---|---|---|---|---|---|
| 1980's | 872 | 174 | 470 | 46 | ||||||
| 1990's | -845 | 270 | -1,282 | -985 | -409 | -799 | -77 | -1,660 | -3,437 | -3,496 |
| 2000's | -3,460 | -3,805 | -3,283 | -3,543 | -6,742 | -8,505 | 18,355 | 36,953 | 39,917 | 52,075 |
| 2010's | 83,243 | 81,209 | 82,879 | 97,556 | 85,291 | 86,357 | 84,922 | 91,006 | 85,747 | 80,683 |
| 2020's | 73,155 | 84,477 | 87,468 | 103,869 |
| - = No Data Reported; -- = Not Applicable; NA = Not Available; W = Withheld to avoid disclosure of individual company data. |
| Release Date: 6/28/2024 |
| Next Release Date: 8/30/2024 |