|
Download Data (XLS File) |
|
||||||||
|
||||||||
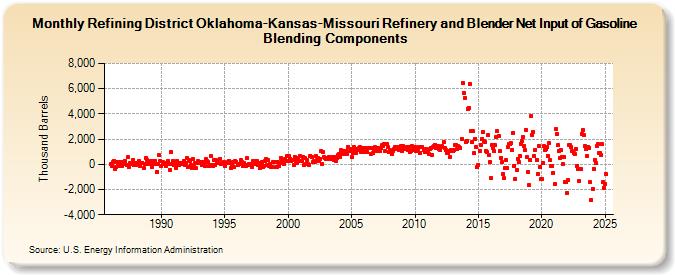
| Refining District Oklahoma-Kansas-Missouri Refinery and Blender Net Input of Gasoline Blending Components (Thousand Barrels) | ||||||||
| Year | Jan | Feb | Mar | Apr | May | Jun | Jul | Aug | Sep | Oct | Nov | Dec |
|---|---|---|---|---|---|---|---|---|---|---|---|---|
| 1986 | 32 | -104 | 152 | 291 | -404 | -211 | 145 | 35 | -99 | 168 | -80 | -117 |
| 1987 | 177 | 269 | 24 | -79 | 544 | -185 | 66 | 20 | 88 | 360 | -86 | 55 |
| 1988 | 96 | -55 | -44 | 228 | -98 | 79 | 128 | -328 | -11 | 536 | 381 | 30 |
| 1989 | 136 | 17 | 251 | -206 | 9 | 237 | 286 | -11 | -583 | -6 | 703 | 224 |
| 1990 | -144 | 185 | 64 | 0 | -139 | 111 | 254 | -14 | -431 | 975 | 54 | 297 |
| 1991 | -82 | 110 | -310 | 235 | 16 | -39 | 143 | 8 | 121 | 290 | -52 | 103 |
| 1992 | 481 | -207 | 338 | 301 | -32 | -262 | 400 | -206 | 134 | -331 | 126 | 228 |
| 1993 | 193 | 100 | -23 | 165 | -8 | -112 | 388 | 285 | 184 | -96 | -43 | 645 |
| 1994 | -17 | -167 | 325 | -78 | 305 | 206 | 64 | 457 | -10 | 123 | 135 | 194 |
| 1995 | -97 | 91 | 125 | 213 | 289 | 72 | -272 | 61 | 207 | -208 | 268 | 198 |
| 1996 | -19 | 43 | 7 | 305 | 199 | -96 | 80 | -23 | -109 | 490 | -24 | 49 |
| 1997 | 45 | -44 | -206 | 296 | 225 | 5 | 248 | -84 | 132 | -290 | -26 | 163 |
| 1998 | -238 | -140 | 282 | 393 | -25 | 308 | -148 | 7 | -190 | -227 | 201 | 179 |
| 1999 | -235 | -192 | 159 | -150 | 102 | 519 | 351 | 179 | 40 | 412 | 277 | 690 |
| 2000 | 239 | 627 | 458 | 261 | 348 | -41 | 582 | 294 | 116 | 476 | 267 | 697 |
| 2001 | 241 | 224 | 608 | -65 | 461 | 37 | 351 | 39 | -51 | 688 | 541 | 149 |
| 2002 | 251 | 185 | 679 | 310 | 498 | 273 | 408 | 1,023 | 47 | 972 | 553 | 487 |
| 2003 | 412 | 525 | 458 | 584 | 511 | 397 | 593 | 316 | 604 | 250 | 524 | 699 |
| 2004 | 850 | 617 | 1,120 | 1,063 | 828 | 1,084 | 827 | 1,088 | 833 | 1,403 | 1,052 | 1,229 |
| 2005 | 577 | 912 | 1,397 | 1,205 | 892 | 1,185 | 1,137 | 1,319 | 1,368 | 952 | 1,228 | 1,280 |
| 2006 | 995 | 1,319 | 1,057 | 957 | 1,314 | 1,314 | 850 | 1,294 | 901 | 1,135 | 1,334 | 1,113 |
| 2007 | 1,088 | 1,279 | 1,152 | 1,067 | 1,311 | 1,532 | 1,486 | 1,583 | 1,061 | 1,572 | 1,340 | 989 |
| 2008 | 1,118 | 1,031 | 836 | 1,044 | 1,211 | 1,366 | 1,337 | 1,395 | 1,212 | 1,135 | 1,312 | 1,453 |
| 2009 | 1,094 | 1,418 | 1,228 | 1,266 | 1,356 | 1,114 | 1,357 | 948 | 1,065 | 1,439 | 1,155 | 1,130 |
| 2010 | 1,360 | 1,037 | 1,100 | 1,243 | 1,347 | 915 | 1,361 | 1,358 | 1,120 | 1,011 | 1,237 | 1,085 |
| 2011 | 937 | 836 | 1,227 | 1,324 | 772 | 1,365 | 1,458 | 1,564 | 1,255 | 1,483 | 1,465 | 1,224 |
| 2012 | 1,121 | 1,388 | 1,432 | 1,737 | 1,328 | 1,130 | 858 | 881 | 1,049 | 575 | 1,158 | 1,026 |
| 2013 | 1,036 | 1,122 | 1,516 | 1,537 | 1,198 | 1,423 | 1,390 | 1,286 | 2,002 | 6,475 | 5,684 | 5,275 |
| 2014 | 1,769 | 1,872 | 4,417 | 4,496 | 6,400 | 2,639 | 1,739 | 2,620 | 863 | 2,026 | 1,395 | -202 |
| 2015 | -28 | 1,059 | 1,552 | 1,985 | 2,546 | 1,876 | 1,752 | 1,094 | 980 | 2,317 | 707 | 160 |
| 2016 | -1,125 | 1,559 | 1,263 | 1,025 | 1,498 | 2,205 | 2,606 | 2,247 | 1,020 | 510 | 148 | -771 |
| 2017 | -1,093 | -308 | 305 | -257 | 1,410 | 1,577 | 1,628 | 1,654 | 1,173 | 2,522 | -105 | -1,143 |
| 2018 | -469 | 420 | 213 | 684 | 1,633 | 1,842 | 2,148 | 1,436 | 1,136 | 2,740 | 563 | -625 |
| 2019 | -1,660 | 341 | 3,796 | 2,351 | 2,559 | 648 | 1,168 | 363 | -777 | 1,466 | -211 | -1,196 |
| 2020 | -1,153 | 117 | 1,430 | 1,124 | 1,245 | 1,390 | 655 | 1,652 | 316 | -146 | -127 | -701 |
| 2021 | -1,568 | 2,815 | 2,427 | 1,501 | 1,039 | 523 | 1,171 | 606 | 18 | 605 | -1,428 | -1,426 |
| 2022 | -2,283 | -1,283 | 1,508 | 1,496 | 1,368 | 1,047 | 891 | 847 | 1,175 | -122 | -362 | -1,361 |
| 2023 | -403 | -389 | 2,422 | 2,683 | 2,317 | 1,444 | 1,194 | 665 | 1,391 | 1,327 | -1,431 | -2,823 |
| 2024 | -1,934 | |||||||||||
| - = No Data Reported; -- = Not Applicable; NA = Not Available; W = Withheld to avoid disclosure of individual company data. |
| Release Date: 3/29/2024 |
| Next Release Date: 4/30/2024 |