|
Download Data (XLS File) |
|
||||||||
|
||||||||
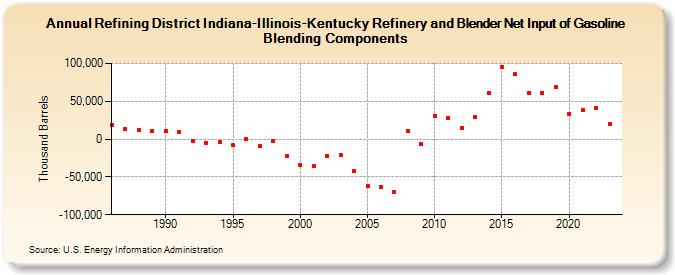
| Refining District Indiana-Illinois-Kentucky Refinery and Blender Net Input of Gasoline Blending Components (Thousand Barrels) | ||||||||
| Decade | Year-0 | Year-1 | Year-2 | Year-3 | Year-4 | Year-5 | Year-6 | Year-7 | Year-8 | Year-9 |
|---|---|---|---|---|---|---|---|---|---|---|
| 1980's | 18,540 | 13,527 | 11,940 | 10,951 | ||||||
| 1990's | 10,336 | 9,368 | -2,073 | -4,796 | -3,573 | -8,396 | -29 | -9,380 | -2,481 | -22,687 |
| 2000's | -33,932 | -35,556 | -22,517 | -20,601 | -42,416 | -62,374 | -63,213 | -69,770 | 10,942 | -6,654 |
| 2010's | 30,563 | 27,931 | 15,132 | 28,987 | 60,720 | 95,708 | 86,263 | 60,958 | 61,371 | 68,312 |
| 2020's | 33,522 | 38,384 | 41,592 | 20,301 |
| - = No Data Reported; -- = Not Applicable; NA = Not Available; W = Withheld to avoid disclosure of individual company data. |
| Release Date: 6/28/2024 |
| Next Release Date: 8/30/2024 |