|
Download Data (XLS File) |
|
||||||||
|
||||||||
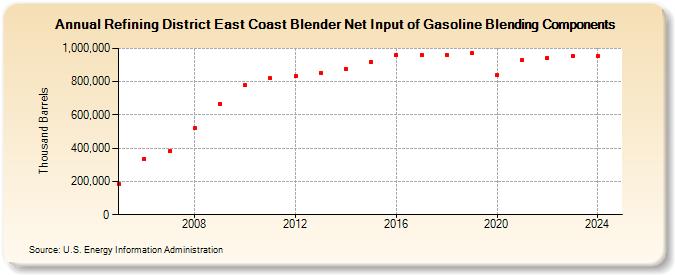
| Refining District East Coast Blender Net Input of Gasoline Blending Components (Thousand Barrels) | ||||||||
| Decade | Year-0 | Year-1 | Year-2 | Year-3 | Year-4 | Year-5 | Year-6 | Year-7 | Year-8 | Year-9 |
|---|---|---|---|---|---|---|---|---|---|---|
| 2000's | 182,574 | 336,464 | 380,791 | 520,553 | 668,356 | |||||
| 2010's | 776,948 | 819,005 | 831,436 | 853,559 | 876,985 | 919,595 | 961,191 | 959,831 | 960,917 | 972,119 |
| 2020's | 837,299 | 927,816 | 944,458 | 952,800 |
| - = No Data Reported; -- = Not Applicable; NA = Not Available; W = Withheld to avoid disclosure of individual company data. |
| Release Date: 3/29/2024 |
| Next Release Date: 8/30/2024 |