|
Download Data (XLS File) |
|
||||||||
|
||||||||
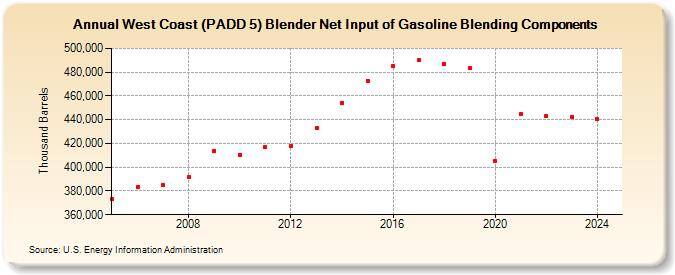
| West Coast (PADD 5) Blender Net Input of Gasoline Blending Components (Thousand Barrels) | ||||||||
| Decade | Year-0 | Year-1 | Year-2 | Year-3 | Year-4 | Year-5 | Year-6 | Year-7 | Year-8 | Year-9 |
|---|---|---|---|---|---|---|---|---|---|---|
| 2000's | 372,930 | 383,133 | 384,733 | 391,611 | 414,036 | |||||
| 2010's | 410,625 | 417,034 | 417,775 | 432,990 | 454,326 | 472,790 | 485,312 | 490,010 | 487,275 | 483,211 |
| 2020's | 405,539 | 444,813 | 442,894 | 442,100 |
| - = No Data Reported; -- = Not Applicable; NA = Not Available; W = Withheld to avoid disclosure of individual company data. |
| Release Date: 3/29/2024 |
| Next Release Date: 8/30/2024 |